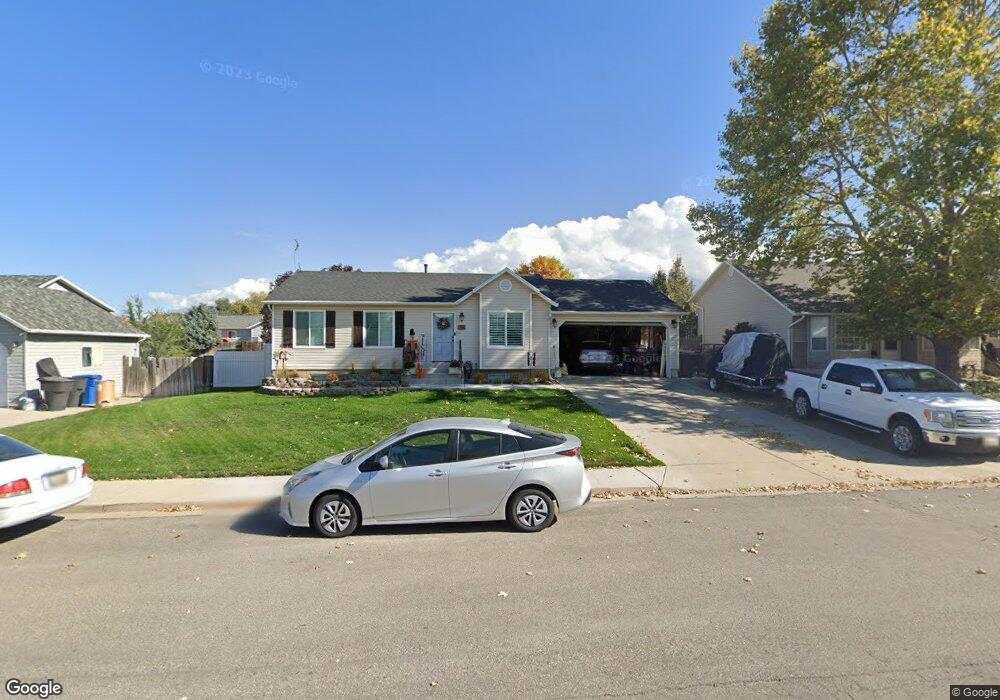
1195 S 880 W Payson, UT 84651
Estimated Value: $488,761 - $507,000
3
Beds
2
Baths
1,481
Sq Ft
$337/Sq Ft
Est. Value
About This Home
This home is located at 1195 S 880 W, Payson, UT 84651 and is currently estimated at $498,587, approximately $336 per square foot. 1195 S 880 W is a home located in Utah County with nearby schools including Wilson Elementary School, Payson Junior High School, and Mt. Nebo Middle.
Ownership History
Date
Name
Owned For
Owner Type
Purchase Details
Closed on
Feb 28, 2023
Sold by
Crews Michael Lee
Bought by
Michael Lee Crews And Kimberly Crews Family T
Current Estimated Value
Purchase Details
Closed on
Jul 10, 1996
Sold by
Woodriver Development Inc
Bought by
Crews Michael Lee and Crews Kimberly
Home Financials for this Owner
Home Financials are based on the most recent Mortgage that was taken out on this home.
Original Mortgage
$101,465
Interest Rate
8.03%
Mortgage Type
FHA
Create a Home Valuation Report for This Property
The Home Valuation Report is an in-depth analysis detailing your home's value as well as a comparison with similar homes in the area
Home Values in the Area
Average Home Value in this Area
Purchase History
| Date | Buyer | Sale Price | Title Company |
|---|---|---|---|
| Michael Lee Crews And Kimberly Crews Family T | -- | -- | |
| Crews Michael Lee | -- | Metro National Title |
Source: Public Records
Mortgage History
| Date | Status | Borrower | Loan Amount |
|---|---|---|---|
| Previous Owner | Crews Michael Lee | $101,465 |
Source: Public Records
Tax History
| Year | Tax Paid | Tax Assessment Tax Assessment Total Assessment is a certain percentage of the fair market value that is determined by local assessors to be the total taxable value of land and additions on the property. | Land | Improvement |
|---|---|---|---|---|
| 2025 | $2,405 | $255,915 | -- | -- |
| 2024 | $2,405 | $244,750 | $0 | $0 |
| 2023 | $2,441 | $249,150 | $0 | $0 |
| 2022 | $2,414 | $242,275 | $0 | $0 |
| 2021 | $2,036 | $327,700 | $99,800 | $227,900 |
| 2020 | $1,906 | $300,200 | $86,800 | $213,400 |
| 2019 | $1,790 | $289,100 | $86,800 | $202,300 |
| 2018 | $1,627 | $253,200 | $67,400 | $185,800 |
| 2017 | $1,516 | $126,885 | $0 | $0 |
| 2016 | $1,397 | $116,160 | $0 | $0 |
| 2015 | $1,233 | $101,805 | $0 | $0 |
| 2014 | $1,106 | $92,015 | $0 | $0 |
Source: Public Records
Map
Nearby Homes
- 1172 S 880 W
- 1128 W 1150 S Unit 9
- 1116 W 1290 S
- 1216 S 1150 W Unit 19
- 1192 W 1130 St S Unit 202
- 1152 W 1000 S
- 1024 S 1170 W
- 802 Brookside Ct
- 528 W 1150 S
- 1531 S 910 W
- 588 W 1450 S
- 1579 S 910 W
- 347 W 1380 S
- 626 S 800 W Unit 32
- 1631 S Highway 198
- 609 W Saddlebrook Dr
- 613 W Saddlebrook Dr
- 1605 S 1100 W
- 9022 S 4400 W
- 527 S 1000 W
Your Personal Tour Guide
Ask me questions while you tour the home.