Estimated Value: $419,227
--
Bed
--
Bath
4,200
Sq Ft
$100/Sq Ft
Est. Value
About This Home
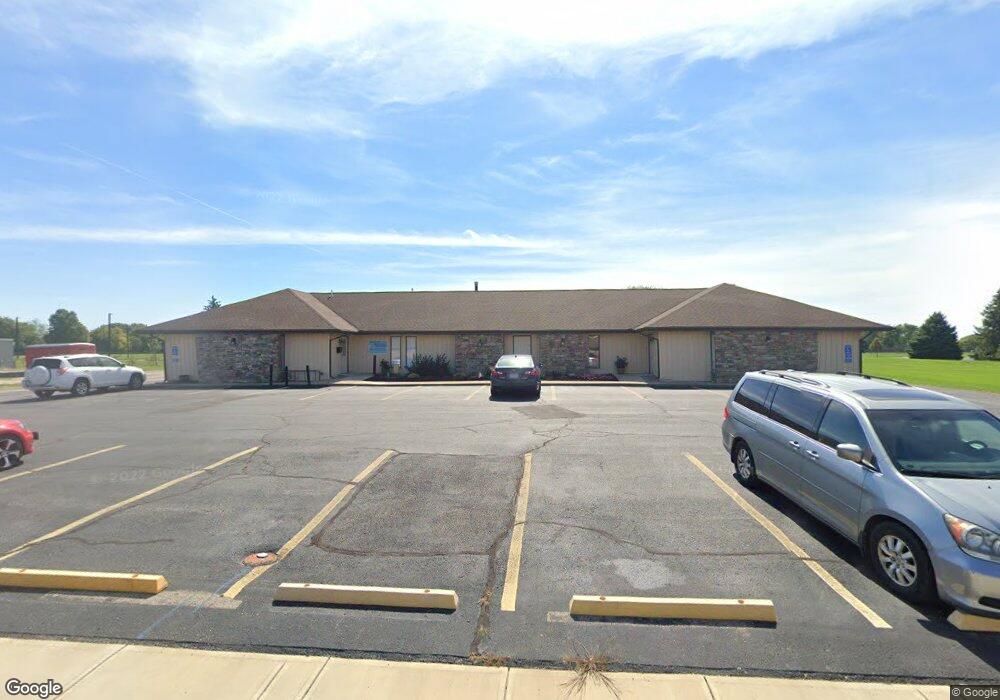
This home is located at 1195 W 2nd St, Xenia, OH 45385 and is currently estimated at $419,227, approximately $99 per square foot. 1195 W 2nd St is a home located in Greene County with nearby schools including Xenia High School, Summit Academy Community School for Alternative Learners - Xenia, and Legacy Christian Academy.
Ownership History
Date
Name
Owned For
Owner Type
Purchase Details
Closed on
Aug 18, 2017
Sold by
Greene County Council On Aging
Bought by
Greene County Council On Aging
Current Estimated Value
Purchase Details
Closed on
Dec 24, 2014
Sold by
First Church Of The Nazarene
Bought by
Greene County Council Of Aging
Purchase Details
Closed on
Nov 4, 2009
Sold by
Medical Services Associates Inc
Bought by
First Church Of The Nazarene
Purchase Details
Closed on
Aug 18, 1998
Sold by
Schwab Louis
Bought by
Medical Services Associates Inc
Home Financials for this Owner
Home Financials are based on the most recent Mortgage that was taken out on this home.
Original Mortgage
$200,000
Interest Rate
6.99%
Create a Home Valuation Report for This Property
The Home Valuation Report is an in-depth analysis detailing your home's value as well as a comparison with similar homes in the area
Home Values in the Area
Average Home Value in this Area
Purchase History
| Date | Buyer | Sale Price | Title Company |
|---|---|---|---|
| Greene County Council On Aging | -- | None Available | |
| Greene County Council Of Aging | $200,000 | None Available | |
| First Church Of The Nazarene | $165,000 | Attorney | |
| Medical Services Associates Inc | $250,000 | -- | |
| Schwab Louis | $215,000 | -- |
Source: Public Records
Mortgage History
| Date | Status | Borrower | Loan Amount |
|---|---|---|---|
| Previous Owner | Medical Services Associates Inc | $200,000 |
Source: Public Records
Tax History Compared to Growth
Tax History
| Year | Tax Paid | Tax Assessment Tax Assessment Total Assessment is a certain percentage of the fair market value that is determined by local assessors to be the total taxable value of land and additions on the property. | Land | Improvement |
|---|---|---|---|---|
| 2024 | -- | $117,910 | $26,890 | $91,020 |
| 2023 | $0 | $117,910 | $26,890 | $91,020 |
| 2022 | $0 | $111,020 | $26,890 | $84,130 |
| 2021 | $0 | $111,020 | $26,890 | $84,130 |
| 2020 | $0 | $111,020 | $26,890 | $84,130 |
| 2019 | $0 | $100,960 | $26,890 | $74,070 |
| 2018 | $0 | $96,890 | $22,820 | $74,070 |
| 2017 | $0 | $96,890 | $22,820 | $74,070 |
| 2016 | $0 | $99,700 | $22,820 | $76,880 |
| 2015 | -- | $99,700 | $22,820 | $76,880 |
| 2014 | -- | $99,700 | $22,820 | $76,880 |
Source: Public Records
Map
Nearby Homes
- 1342 Kylemore Dr
- 1223 June Dr
- 1233 June Dr
- 1283 June Dr
- 1144 Rockwell Dr
- 1391 June Dr
- 1208 Bellbrook Ave
- 305-325 Bellbrook Ave
- 1272 Bellbrook Ave
- 343 Sheelin Rd
- 453 Walnut St
- 1351 Omard Dr
- 1568 Cheyenne Dr
- 1618 Navajo Dr
- 883 Omard Dr
- 509 Antrim Rd
- 912 Omard Dr
- 121 S Progress Dr
- 1778 Arapaho Dr
- 1653 Seneca Dr