Estimated Value: $117,267 - $174,000
3
Beds
1
Bath
1,293
Sq Ft
$111/Sq Ft
Est. Value
About This Home
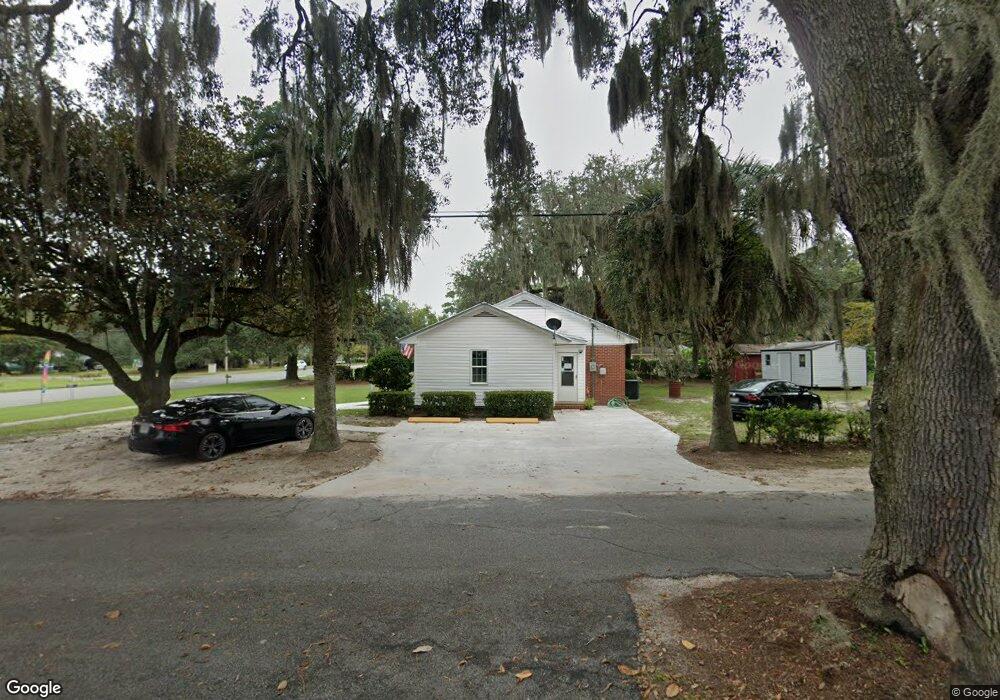
This home is located at 1195 W Orange St, Jesup, GA 31545 and is currently estimated at $143,317, approximately $110 per square foot. 1195 W Orange St is a home located in Wayne County with nearby schools including Bacon Elementary School, Martha Puckett Middle School, and Wayne County High School.
Ownership History
Date
Name
Owned For
Owner Type
Purchase Details
Closed on
May 1, 2020
Sold by
Manning James G
Bought by
Durden Linda M
Current Estimated Value
Home Financials for this Owner
Home Financials are based on the most recent Mortgage that was taken out on this home.
Original Mortgage
$71,000
Outstanding Balance
$62,916
Interest Rate
3.3%
Mortgage Type
FHA
Estimated Equity
$80,401
Purchase Details
Closed on
May 7, 2019
Sold by
Triple R Rentals Llc
Bought by
Manning James G and Manning Adrianne C
Home Financials for this Owner
Home Financials are based on the most recent Mortgage that was taken out on this home.
Original Mortgage
$60,646
Interest Rate
4.1%
Mortgage Type
New Conventional
Purchase Details
Closed on
Jul 20, 2012
Sold by
Roberson Bessie G
Bought by
Triple R Rental Llc
Purchase Details
Closed on
Jul 1, 2001
Sold by
Roberson Richard R and Roberson Essi
Bought by
Roberson Bessie G
Purchase Details
Closed on
Feb 1, 1974
Bought by
Roberson Richard R and Roberson Essi
Purchase Details
Closed on
Mar 1, 1952
Create a Home Valuation Report for This Property
The Home Valuation Report is an in-depth analysis detailing your home's value as well as a comparison with similar homes in the area
Home Values in the Area
Average Home Value in this Area
Purchase History
| Date | Buyer | Sale Price | Title Company |
|---|---|---|---|
| Durden Linda M | $79,000 | -- | |
| Manning James G | $110,000 | -- | |
| Triple R Rental Llc | -- | -- | |
| Roberson Bessie G | -- | -- | |
| Roberson Richard R | -- | -- | |
| -- | -- | -- |
Source: Public Records
Mortgage History
| Date | Status | Borrower | Loan Amount |
|---|---|---|---|
| Open | Durden Linda M | $71,000 | |
| Previous Owner | Manning James G | $60,646 |
Source: Public Records
Tax History Compared to Growth
Tax History
| Year | Tax Paid | Tax Assessment Tax Assessment Total Assessment is a certain percentage of the fair market value that is determined by local assessors to be the total taxable value of land and additions on the property. | Land | Improvement |
|---|---|---|---|---|
| 2024 | $1,088 | $35,567 | $3,976 | $31,591 |
| 2023 | $1,121 | $31,678 | $3,976 | $27,702 |
| 2022 | $723 | $22,960 | $3,976 | $18,984 |
| 2021 | $773 | $22,932 | $3,948 | $18,984 |
| 2020 | $768 | $22,932 | $3,948 | $18,984 |
| 2019 | $824 | $22,932 | $3,948 | $18,984 |
| 2018 | $824 | $22,932 | $3,948 | $18,984 |
| 2017 | $709 | $22,932 | $3,948 | $18,984 |
| 2016 | $686 | $22,932 | $3,948 | $18,984 |
| 2014 | $688 | $22,932 | $3,948 | $18,984 |
| 2013 | -- | $22,932 | $3,948 | $18,984 |
Source: Public Records
Map
Nearby Homes
- 1167 W Orange St
- 1201 W Orange St
- 196 Black St
- 194 Black St
- 218 Black St
- 1210 W Orange St
- 1237 W Orange St
- 1216 W Orange St
- 0 Black St Unit 7525885
- 280 Hamburg St
- 1137 W Orange St
- 236 Black St
- 1236 W Orange St
- 192 Black St
- 248 Hamburg St
- 1257 W Orange St
- 197 Black St
- 1246 W Orange St
- 281 Hamburg St
- 215 Black St