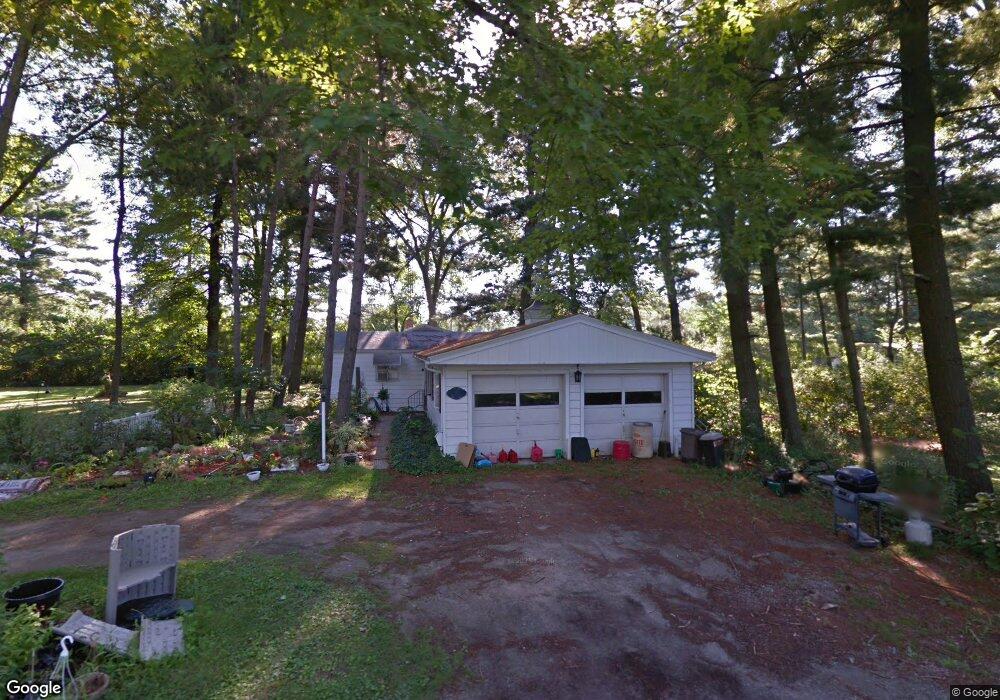
11953 Shaffer Rd Swanton, OH 43558
West Lucas County NeighborhoodEstimated Value: $113,000 - $256,000
3
Beds
1
Bath
1,056
Sq Ft
$149/Sq Ft
Est. Value
About This Home
This home is located at 11953 Shaffer Rd, Swanton, OH 43558 and is currently estimated at $156,938, approximately $148 per square foot. 11953 Shaffer Rd is a home located in Lucas County with nearby schools including Swanton High School, Swanton Middle School, and St. Richard School.
Ownership History
Date
Name
Owned For
Owner Type
Purchase Details
Closed on
May 30, 2023
Sold by
Hughes Alexander Lee
Bought by
Hunt-Sanchez Sabrina and Sanchez Bryan L
Current Estimated Value
Purchase Details
Closed on
Nov 25, 2020
Sold by
Cameron Amy L
Bought by
Hughes Debbie
Purchase Details
Closed on
Sep 25, 2007
Sold by
Oak River Corral Llc
Bought by
Cameron Amy L
Home Financials for this Owner
Home Financials are based on the most recent Mortgage that was taken out on this home.
Original Mortgage
$118,000
Interest Rate
6.66%
Mortgage Type
Purchase Money Mortgage
Purchase Details
Closed on
May 19, 2005
Sold by
Maguire Patrick R and Maguire Kay M
Bought by
Oak River Corral Llc
Purchase Details
Closed on
Sep 17, 1999
Sold by
Munding Earl H
Bought by
Maguire Patrick R and Maguire Kay M
Home Financials for this Owner
Home Financials are based on the most recent Mortgage that was taken out on this home.
Original Mortgage
$93,600
Interest Rate
7.93%
Purchase Details
Closed on
Jun 12, 1999
Sold by
Munding Earl H
Bought by
Flynn Charlottann
Create a Home Valuation Report for This Property
The Home Valuation Report is an in-depth analysis detailing your home's value as well as a comparison with similar homes in the area
Home Values in the Area
Average Home Value in this Area
Purchase History
| Date | Buyer | Sale Price | Title Company |
|---|---|---|---|
| Hunt-Sanchez Sabrina | $55,000 | None Listed On Document | |
| Hughes Debbie | -- | Area Title | |
| Cameron Amy L | $118,000 | Metro | |
| Oak River Corral Llc | $117,000 | -- | |
| Maguire Patrick R | $117,000 | -- | |
| Flynn Charlottann | $10,000 | -- |
Source: Public Records
Mortgage History
| Date | Status | Borrower | Loan Amount |
|---|---|---|---|
| Previous Owner | Cameron Amy L | $118,000 | |
| Previous Owner | Maguire Patrick R | $93,600 |
Source: Public Records
Map
Nearby Homes
- 11530 Shaffer Rd
- 580 S Berkey Southern Rd
- 1610 Berkey Rd
- 10637 Old State Line Rd
- 0 Airport Hwy Unit 225021918
- 13620 Brindley Rd
- 4303 S Berkey Southern Rd
- 225 Kierra Ln
- 11344 Monclova Rd
- 9800 Salisbury Rd
- 3725 Eber Rd
- 105 Pennsylvania Ave
- 120 E Airport Hwy
- 9616 Old State Line Rd
- 4660 S Berkey Southern Rd
- 4025 Laplante Rd
- 233 N Main St
- 227 Kierra Ln
- 1402 S Crissey Rd
- 304 W Garfield Ave
- 11959 Shaffer Rd
- 11997 Shaffer Rd
- 11937 Shaffer Rd
- 12025 Shaffer Rd
- 12019 Shaffer Rd
- 11925 Shaffer Rd
- 11900 Shaffer Rd
- 11871 Shaffer Rd
- 11859 Shaffer Rd
- 12065 Shaffer Rd
- 12107 Shaffer Rd
- 11843 Shaffer Rd
- 11922 Shaffer Rd
- 11850 Shaffer Rd
- 12123 Shaffer Rd
- 2070 S Berkey Southern Rd
- 11828 Shaffer Rd
- 2032 S Berkey Southern Rd
- 2048 S Berkey Southern Rd
- 2012 S Berkey Southern Rd
Your Personal Tour Guide
Ask me questions while you tour the home.