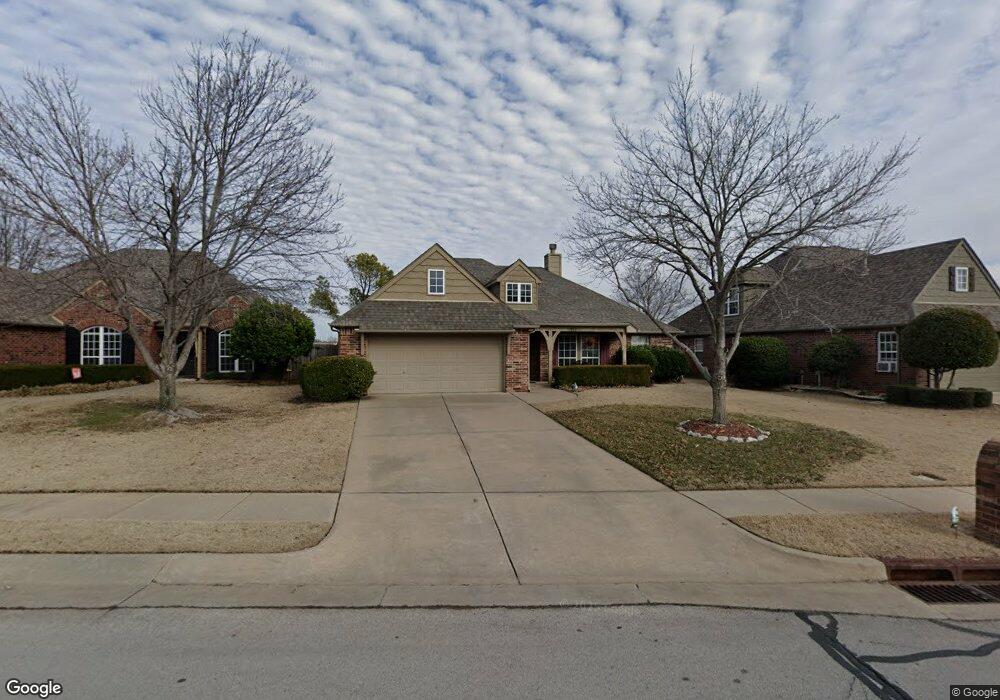
11955 S 73rd East Ave Bixby, OK 74008
North Bixby NeighborhoodEstimated Value: $313,470 - $329,000
--
Bed
2
Baths
2,000
Sq Ft
$160/Sq Ft
Est. Value
About This Home
This home is located at 11955 S 73rd East Ave, Bixby, OK 74008 and is currently estimated at $319,368, approximately $159 per square foot. 11955 S 73rd East Ave is a home located in Tulsa County with nearby schools including Bixby North Elementary, Bixby North Intermediate, and Bixby Middle School.
Ownership History
Date
Name
Owned For
Owner Type
Purchase Details
Closed on
Jun 7, 2019
Sold by
Ford Teresa L
Bought by
The Teresa L Ford Revocable Trust
Current Estimated Value
Purchase Details
Closed on
Jul 12, 2017
Sold by
Ford Teresa L
Bought by
Ford Teresa L and Ford Mercus B
Purchase Details
Closed on
Apr 8, 2017
Sold by
Ford Teresa L and Jordan Hazel V
Bought by
Ford Teresa L and Ford Craig J
Purchase Details
Closed on
Mar 19, 2017
Sold by
Fora Teresa L and Jordan Belinda G
Bought by
Ford Teresa L and Ford Marcus B
Purchase Details
Closed on
Oct 2, 2015
Sold by
Jordan Hazel V
Bought by
Jordan Hazel V Trus and Jordan
Purchase Details
Closed on
Apr 26, 2007
Sold by
Maxwell Jeffrey L
Bought by
Jordan John R and Jordan Hazel V
Purchase Details
Closed on
Jul 20, 2005
Sold by
Maxwell Cynthia L
Bought by
Maxwell Jeffrey L
Purchase Details
Closed on
Nov 23, 2004
Sold by
Terry L Davis Homes Inc
Bought by
Maxwell Jeffrey L
Create a Home Valuation Report for This Property
The Home Valuation Report is an in-depth analysis detailing your home's value as well as a comparison with similar homes in the area
Home Values in the Area
Average Home Value in this Area
Purchase History
| Date | Buyer | Sale Price | Title Company |
|---|---|---|---|
| The Teresa L Ford Revocable Trust | -- | None Available | |
| Ford Teresa L | -- | Titleone Llc | |
| Ford Teresa L | -- | None Available | |
| Ford Teresa L | $82,676 | None Available | |
| Ford Teresa L | -- | None Available | |
| Jordan Hazel V Trus | -- | -- | |
| Jordan John R | $170,000 | Firstitle & Abstract Service | |
| Maxwell Jeffrey L | -- | -- | |
| Maxwell Jeffrey L | $166,500 | -- |
Source: Public Records
Tax History Compared to Growth
Tax History
| Year | Tax Paid | Tax Assessment Tax Assessment Total Assessment is a certain percentage of the fair market value that is determined by local assessors to be the total taxable value of land and additions on the property. | Land | Improvement |
|---|---|---|---|---|
| 2024 | $2,876 | $20,560 | $3,028 | $17,532 |
| 2023 | $2,876 | $21,560 | $3,199 | $18,361 |
| 2022 | $2,889 | $20,560 | $3,828 | $16,732 |
| 2021 | $2,700 | $20,560 | $3,828 | $16,732 |
| 2020 | $2,717 | $20,560 | $3,828 | $16,732 |
| 2019 | $2,727 | $20,560 | $3,828 | $16,732 |
| 2018 | $2,702 | $20,560 | $3,828 | $16,732 |
| 2017 | $2,618 | $21,047 | $3,649 | $17,398 |
| 2016 | $2,507 | $20,434 | $3,543 | $16,891 |
| 2015 | $2,324 | $23,150 | $4,014 | $19,136 |
| 2014 | $2,250 | $20,009 | $4,014 | $15,995 |
Source: Public Records
Map
Nearby Homes
- 7362 E 119th Place S
- 7362 E 119th St S
- 11702 S 75th East Ave
- 7700 E 118th St S
- 11939 S 68th Ave E
- 11919 S 68th East Ave
- 12050 S 68th East Ave
- 12451 S 75th Ave E
- 12300 S Memorial Dr
- 6683 E 122nd Place S
- 12241 S 66th East Ave
- 12464 S 71st East Ave
- 12545 S 73rd East Place
- 6805 E 115th Place S
- 8986 E 161st Place S
- 15622 75th East Ave
- 6678 E 123rd Place S
- 12209 S 65th Place E
- 12249 S 65th East Place
- 6807 E 125th St S
- 11951 S 73rd East Ave
- 11959 S 73rd East Ave
- 11963 S 73rd East Ave
- 11947 S 73rd Ave E
- 11947 S 73rd East Ave
- 11950 S 73rd East Ave
- 11946 S 73rd East Ave
- 11967 S 73rd East Ave
- 11943 S 73rd East Ave
- 11971 S 73rd East Ave
- 11954 S 73rd East Ave
- 11942 S 73rd East Ave
- 11939 S 73rd East Ave
- 11970 S 73rd East Ave
- 7346 E 119th Place S
- 11975 S 73rd East Ave
- 11958 S 73rd East Ave
- 7350 E 119th Place S
- 11966 S 73rd East Ave
- 0 E 119th Place Unit 1933042