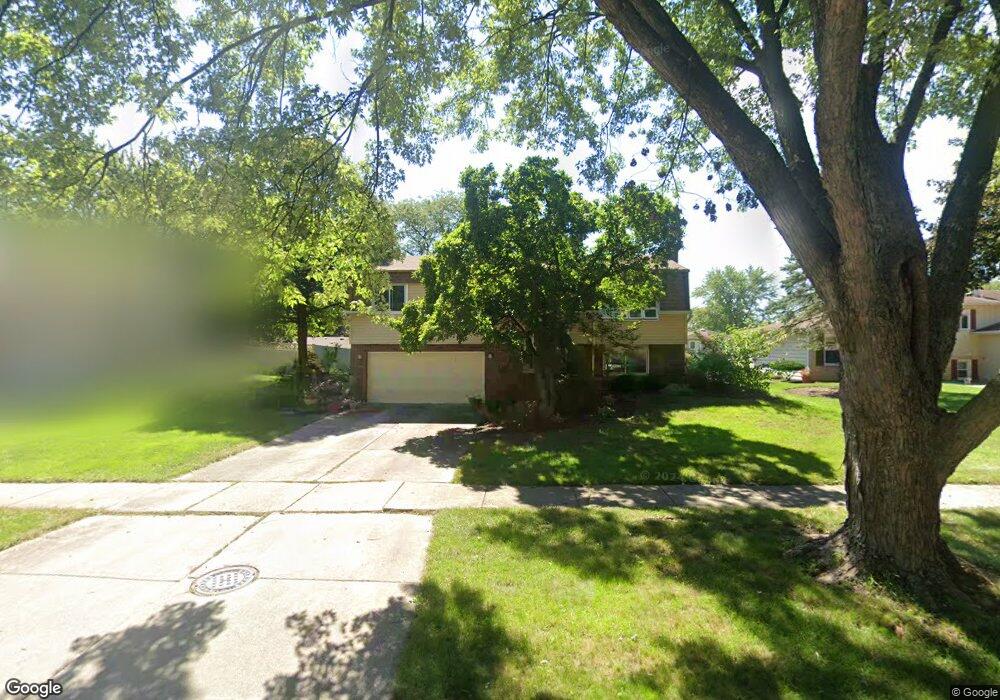
1196 Kent Ct Wheaton, IL 60189
North Danada NeighborhoodEstimated Value: $349,985 - $465,000
3
Beds
2
Baths
1,100
Sq Ft
$384/Sq Ft
Est. Value
About This Home
This home is located at 1196 Kent Ct, Wheaton, IL 60189 and is currently estimated at $422,496, approximately $384 per square foot. 1196 Kent Ct is a home located in DuPage County with nearby schools including Wiesbrook Elementary School, Hubble Middle School, and Wheaton Warrenville South High School.
Ownership History
Date
Name
Owned For
Owner Type
Purchase Details
Closed on
May 30, 2014
Sold by
Connell Gail F O
Bought by
Connell Gail F O and Gail F O Connell Declaration Of Living
Current Estimated Value
Purchase Details
Closed on
Sep 17, 2003
Sold by
Wheeler Jeffrey A and Wheeler Lynette T
Bought by
Oconnell Gail F
Home Financials for this Owner
Home Financials are based on the most recent Mortgage that was taken out on this home.
Original Mortgage
$247,950
Outstanding Balance
$109,140
Interest Rate
5.5%
Mortgage Type
Purchase Money Mortgage
Estimated Equity
$313,356
Purchase Details
Closed on
May 1, 1995
Sold by
Matejcak Lawrence J and Matejcak Susan I
Bought by
Wheeler Jeffrey A and Wheeler Lynette T
Home Financials for this Owner
Home Financials are based on the most recent Mortgage that was taken out on this home.
Original Mortgage
$139,500
Interest Rate
8.4%
Create a Home Valuation Report for This Property
The Home Valuation Report is an in-depth analysis detailing your home's value as well as a comparison with similar homes in the area
Home Values in the Area
Average Home Value in this Area
Purchase History
| Date | Buyer | Sale Price | Title Company |
|---|---|---|---|
| Connell Gail F O | -- | None Available | |
| Oconnell Gail F | $261,000 | Premier Title | |
| Wheeler Jeffrey A | $155,000 | -- |
Source: Public Records
Mortgage History
| Date | Status | Borrower | Loan Amount |
|---|---|---|---|
| Open | Oconnell Gail F | $247,950 | |
| Previous Owner | Wheeler Jeffrey A | $139,500 |
Source: Public Records
Tax History
| Year | Tax Paid | Tax Assessment Tax Assessment Total Assessment is a certain percentage of the fair market value that is determined by local assessors to be the total taxable value of land and additions on the property. | Land | Improvement |
|---|---|---|---|---|
| 2024 | $6,383 | $115,028 | $36,970 | $78,058 |
| 2023 | $6,074 | $105,880 | $34,030 | $71,850 |
| 2022 | $6,168 | $100,060 | $32,160 | $67,900 |
| 2021 | $6,136 | $97,690 | $31,400 | $66,290 |
| 2020 | $6,112 | $96,780 | $31,110 | $65,670 |
| 2019 | $5,959 | $94,230 | $30,290 | $63,940 |
| 2018 | $5,691 | $89,570 | $28,540 | $61,030 |
| 2017 | $5,586 | $86,270 | $27,490 | $58,780 |
| 2016 | $5,489 | $82,820 | $26,390 | $56,430 |
| 2015 | $5,420 | $79,010 | $25,180 | $53,830 |
| 2014 | $5,240 | $75,620 | $23,680 | $51,940 |
| 2013 | $5,107 | $75,850 | $23,750 | $52,100 |
Source: Public Records
Map
Nearby Homes
- 1265 Windsor Dr
- 1580 College Ln S
- 1720 Lakecliffe Dr Unit A
- 1705 Lakecliffe Dr Unit D
- 23W160 Woodcroft Dr
- 953 Cordova Ct
- 23W070 Mulberry Ln
- 1129 Rhodes Ct
- 570 Riva Ct
- 30 Danada Dr
- 1678 Groton Ct
- 1581 Groton Ln
- 429 Sandhurst Cir Unit 1
- 2S744 Lakeside Dr Unit 21
- 840 Sheldon Ct Unit B
- 448 Raintree Ct Unit 1C
- 1601 Castbourne Ct
- 453 Raintree Dr Unit 5A
- 453 Raintree Dr Unit 1H
- 470 Fawell Blvd Unit 510
Your Personal Tour Guide
Ask me questions while you tour the home.