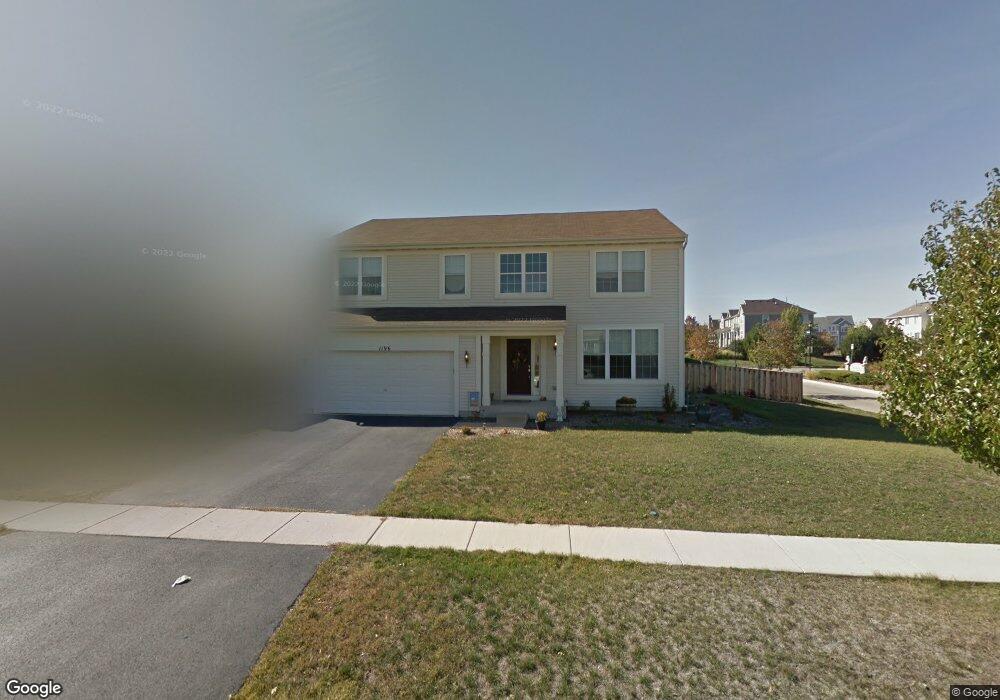
1196 Larkspur Ct Unit 4 Pingree Grove, IL 60140
Estimated Value: $438,777 - $463,000
4
Beds
3
Baths
2,867
Sq Ft
$157/Sq Ft
Est. Value
About This Home
This home is located at 1196 Larkspur Ct Unit 4, Pingree Grove, IL 60140 and is currently estimated at $450,444, approximately $157 per square foot. 1196 Larkspur Ct Unit 4 is a home located in Kane County with nearby schools including Gary D. Wright Elementary School, West Central Elementary School, and Hampshire Middle School.
Ownership History
Date
Name
Owned For
Owner Type
Purchase Details
Closed on
Sep 15, 2025
Sold by
Clayton Krista M and Clayton William C
Bought by
Clayton Krista
Current Estimated Value
Purchase Details
Closed on
Oct 28, 2011
Sold by
Fannie Mae
Bought by
Clayton Krista M
Home Financials for this Owner
Home Financials are based on the most recent Mortgage that was taken out on this home.
Original Mortgage
$176,649
Interest Rate
4.5%
Mortgage Type
FHA
Purchase Details
Closed on
Jun 13, 2011
Sold by
Dinh Lynda T
Bought by
Federal National Mortgage Association
Purchase Details
Closed on
May 2, 2006
Sold by
Drh Cambridge Homes Inc
Bought by
Dinh Lynda T
Home Financials for this Owner
Home Financials are based on the most recent Mortgage that was taken out on this home.
Original Mortgage
$288,351
Interest Rate
8.25%
Mortgage Type
Purchase Money Mortgage
Create a Home Valuation Report for This Property
The Home Valuation Report is an in-depth analysis detailing your home's value as well as a comparison with similar homes in the area
Home Values in the Area
Average Home Value in this Area
Purchase History
| Date | Buyer | Sale Price | Title Company |
|---|---|---|---|
| Clayton Krista M | $190,000 | First American Title | |
| Federal National Mortgage Association | -- | Old Republic National Title | |
| Dinh Lynda T | $320,500 | First American Title |
Source: Public Records
Mortgage History
| Date | Status | Borrower | Loan Amount |
|---|---|---|---|
| Open | Clayton Krista M | $176,649 | |
| Previous Owner | Dinh Lynda T | $288,351 |
Source: Public Records
Tax History Compared to Growth
Tax History
| Year | Tax Paid | Tax Assessment Tax Assessment Total Assessment is a certain percentage of the fair market value that is determined by local assessors to be the total taxable value of land and additions on the property. | Land | Improvement |
|---|---|---|---|---|
| 2024 | $9,528 | $123,525 | $30,777 | $92,748 |
| 2023 | $9,250 | $111,706 | $27,832 | $83,874 |
| 2022 | $8,949 | $102,993 | $25,661 | $77,332 |
| 2021 | $8,723 | $96,871 | $24,136 | $72,735 |
| 2020 | $8,570 | $94,398 | $23,520 | $70,878 |
| 2019 | $8,386 | $90,602 | $22,574 | $68,028 |
| 2018 | $8,660 | $91,248 | $21,186 | $70,062 |
| 2017 | $8,507 | $86,894 | $20,175 | $66,719 |
| 2016 | $8,481 | $82,725 | $19,207 | $63,518 |
| 2015 | -- | $78,131 | $18,140 | $59,991 |
| 2014 | -- | $77,267 | $17,276 | $59,991 |
| 2013 | -- | $78,684 | $17,593 | $61,091 |
Source: Public Records
Map
Nearby Homes
- 898 Emerald Dr
- 955 Emerald Dr
- 932 Clover Ln
- 562 Lancaster Dr
- Lot 019 Old Stage Rd
- 460 Lancaster Dr
- 1157 Clearwater Dr
- 410 Brookhaven Trail
- 395 Brookhaven Trail
- 700 Brighton Dr
- 1286 Newport Cir
- 1173 Sonoma Ct
- 560 Canterbury Ln
- 1731 Dempsey Cir
- 1385 Broadland Dr
- 672 N Falls Cir
- 1255 Waterfront Ln
- 1482 Hollow Tree Ln
- 1641 Sandcastle Ln
- 1701 Windward Dr
- 1184 Larkspur Ct
- 1244 Larkspur Ct
- 797 Woodfern Dr
- 1178 Larkspur Ct
- 1177 Larkspur Ct
- 1250 Larkspur Ct
- 909 Emerald Dr
- 899 Emerald Dr
- 1241 Larkspur Ct
- 791 Woodfern Dr
- 907 Emerald Dr
- 897 Emerald Dr
- 1171 Larkspur Ct
- 1172 Larkspur Ct
- 889 Emerald Dr
- 905 Emerald Dr
- 895 Emerald Dr
- 1256 Larkspur Ct
- 887 Emerald Dr Unit 2
- 1247 Larkspur Ct