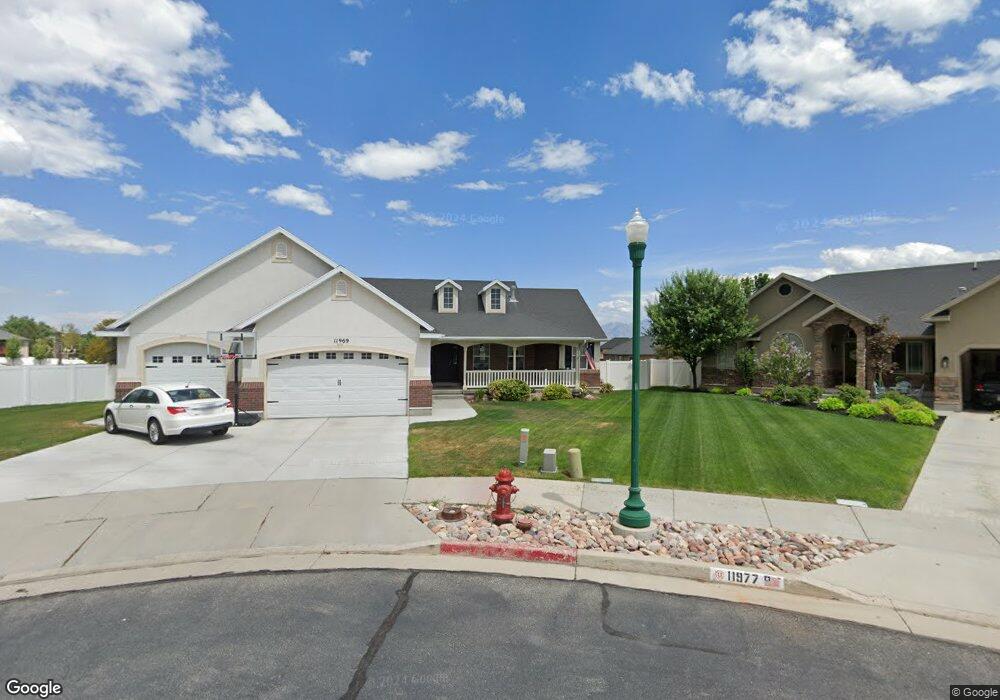
11969 Golden Stone Cir Riverton, UT 84096
Estimated Value: $658,000 - $710,378
3
Beds
2
Baths
1,693
Sq Ft
$402/Sq Ft
Est. Value
About This Home
This home is located at 11969 Golden Stone Cir, Riverton, UT 84096 and is currently estimated at $681,095, approximately $402 per square foot. 11969 Golden Stone Cir is a home located in Salt Lake County with nearby schools including Midas Creek Elementary School, Oquirrh Hills Middle School, and Riverton High School.
Ownership History
Date
Name
Owned For
Owner Type
Purchase Details
Closed on
Oct 22, 2009
Sold by
Davis Wayne L
Bought by
Davis Wayne L and Davis Kathryn H
Current Estimated Value
Purchase Details
Closed on
Nov 7, 2003
Sold by
Silvercrest Homes Lc
Bought by
Davis Wayne L
Home Financials for this Owner
Home Financials are based on the most recent Mortgage that was taken out on this home.
Original Mortgage
$167,000
Outstanding Balance
$77,099
Interest Rate
5.94%
Mortgage Type
Purchase Money Mortgage
Estimated Equity
$603,996
Purchase Details
Closed on
Jul 31, 2003
Sold by
Crater Development Lc
Bought by
Silvercrest Homes Lc
Home Financials for this Owner
Home Financials are based on the most recent Mortgage that was taken out on this home.
Original Mortgage
$167,200
Interest Rate
5.17%
Mortgage Type
Construction
Purchase Details
Closed on
Mar 30, 1995
Sold by
Hoopes Thomas Allen and Hoopes Sandra Young
Bought by
Hoopes Eric James
Create a Home Valuation Report for This Property
The Home Valuation Report is an in-depth analysis detailing your home's value as well as a comparison with similar homes in the area
Home Values in the Area
Average Home Value in this Area
Purchase History
| Date | Buyer | Sale Price | Title Company |
|---|---|---|---|
| Davis Wayne L | -- | Accommodation | |
| Davis Wayne L | -- | Meridian Title | |
| Silvercrest Homes Lc | -- | Meridian Title | |
| Hoopes Eric James | -- | -- |
Source: Public Records
Mortgage History
| Date | Status | Borrower | Loan Amount |
|---|---|---|---|
| Open | Davis Wayne L | $167,000 | |
| Previous Owner | Silvercrest Homes Lc | $167,200 |
Source: Public Records
Tax History Compared to Growth
Tax History
| Year | Tax Paid | Tax Assessment Tax Assessment Total Assessment is a certain percentage of the fair market value that is determined by local assessors to be the total taxable value of land and additions on the property. | Land | Improvement |
|---|---|---|---|---|
| 2025 | $3,505 | $634,200 | $209,800 | $424,400 |
| 2024 | $3,505 | $606,700 | $200,200 | $406,500 |
| 2023 | $3,623 | $591,100 | $202,900 | $388,200 |
| 2022 | $3,772 | $603,800 | $198,900 | $404,900 |
| 2021 | $3,265 | $465,300 | $155,900 | $309,400 |
| 2020 | $3,061 | $406,700 | $155,900 | $250,800 |
| 2019 | $2,989 | $390,400 | $155,900 | $234,500 |
| 2018 | $2,917 | $375,100 | $135,500 | $239,600 |
| 2017 | $2,942 | $368,700 | $135,500 | $233,200 |
| 2016 | $2,877 | $346,000 | $126,600 | $219,400 |
| 2015 | $3,063 | $357,100 | $135,100 | $222,000 |
| 2014 | $2,735 | $312,600 | $119,400 | $193,200 |
Source: Public Records
Map
Nearby Homes
- 4347 W 11770 S
- 12159 Swensen Cir
- 11777 S 4210 W
- 4454 W 11800 S
- 4466 W 11800 S
- 4463 W Harvest Sun Ln
- 12667 S Lincoln Peak Ln Unit 132
- 12667 S Lincoln Peak Ln Unit 125
- 12667 S Lincoln Peak Ln
- 12671 S Lincoln Peak Ln Unit 131
- 12671 S Lincoln Peak Ln
- 12687 S Lincoln Peak Ln Unit 126
- 12687 S Lincoln Peak Ln
- 12693 S Lincoln Peak Ln
- 12668 S Lincoln Peak Ln Unit 109
- 12674 S Lincoln Peak Ln
- 12674 S Lincoln Peak Ln Unit 111
- 12676 S Lincoln Peak Ln
- 12676 S Lincoln Peak Ln Unit 112
- 12682 S Lincoln Peak Ln
- 11977 Golden Stone Cir
- 11966 S Golden Stone Cir
- 11966 Golden Stone Cir
- 4308 Park Hollow Ln
- 4308 W Park Hollow Ln
- 11978 Golden Stone Cir
- 11978 S Golden Stone Cir
- 11962 S Silvery Creek Cove
- 11962 S Silvery Creek Cove
- 11962 S Silvery Creek Cove Unit 27
- 4288 Park Hollow Ln
- 4349 Golden Fox Cir
- 11928 S Scenic Cove
- 4358 W Park Hollow Ln
- 4358 Park Hollow Ln
- 11928 Scenic Cove
- 11938 Scenic Cove
- 11938 S Scenic Cove
- 4359 W Golden Fox Cir
- 4359 Golden Fox Cir