Estimated Value: $114,000 - $173,169
3
Beds
1
Bath
1,200
Sq Ft
$127/Sq Ft
Est. Value
About This Home
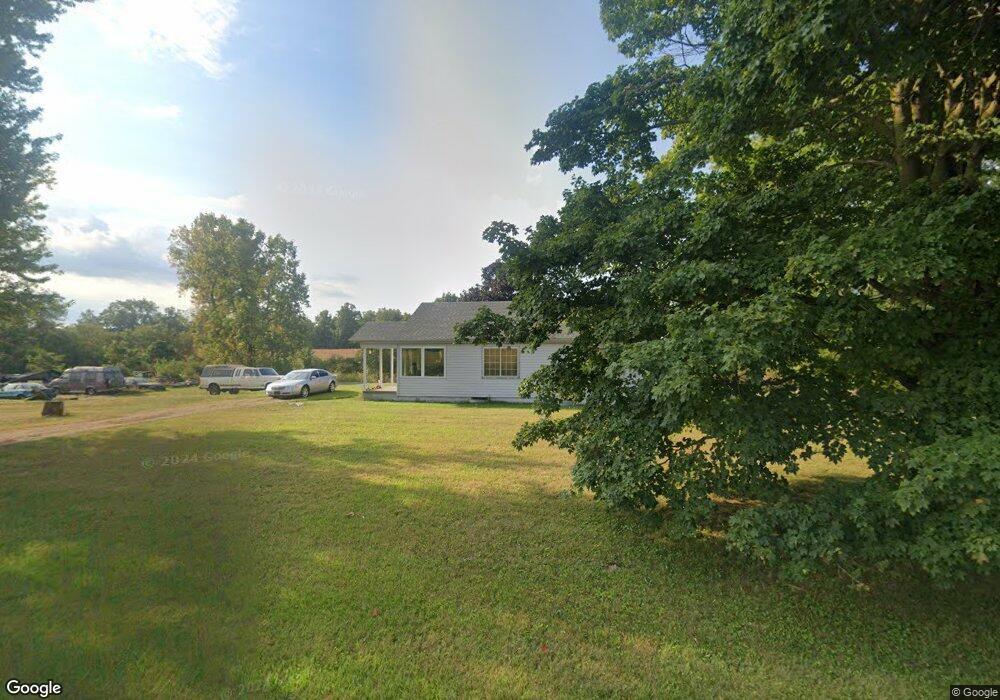
This home is located at 1197 W 950 S, Lynn, IN 47355 and is currently estimated at $152,390, approximately $126 per square foot. 1197 W 950 S is a home located in Randolph County with nearby schools including Randolph Southern Elementary School, Randolph Southern Junior/Senior High School, and Sunrise School.
Ownership History
Date
Name
Owned For
Owner Type
Purchase Details
Closed on
Aug 21, 2008
Sold by
Keister Tammy D
Bought by
Keister Robert D
Current Estimated Value
Create a Home Valuation Report for This Property
The Home Valuation Report is an in-depth analysis detailing your home's value as well as a comparison with similar homes in the area
Home Values in the Area
Average Home Value in this Area
Purchase History
| Date | Buyer | Sale Price | Title Company |
|---|---|---|---|
| Keister Robert D | -- | None Available |
Source: Public Records
Tax History Compared to Growth
Tax History
| Year | Tax Paid | Tax Assessment Tax Assessment Total Assessment is a certain percentage of the fair market value that is determined by local assessors to be the total taxable value of land and additions on the property. | Land | Improvement |
|---|---|---|---|---|
| 2024 | $614 | $112,600 | $15,600 | $97,000 |
| 2023 | $641 | $114,400 | $15,000 | $99,400 |
| 2022 | $721 | $113,900 | $14,400 | $99,500 |
| 2021 | $848 | $116,900 | $20,000 | $96,900 |
| 2020 | $720 | $104,400 | $17,700 | $86,700 |
| 2019 | $645 | $103,100 | $18,100 | $85,000 |
| 2018 | $606 | $97,300 | $17,400 | $79,900 |
| 2017 | $388 | $84,000 | $17,800 | $66,200 |
| 2016 | $373 | $80,800 | $16,600 | $64,200 |
| 2014 | $342 | $77,200 | $16,800 | $60,400 |
| 2013 | $342 | $74,600 | $16,300 | $58,300 |
Source: Public Records
Map
Nearby Homes
- 501 W Sherman St
- 410 N Main St
- 1820 E 700 S
- 0 Round Barn Rd
- 0 Walnut St
- 8292 Main St
- 274 4th St
- 0 Davis
- 701 W Cherry St
- 2336 W New Garden Rd
- 107 N US Highway 27
- 6855 N Centerville Rd
- 9*** County Road 800 W
- 9*** S 800 W
- 219 S Main St
- 5369 E 700 S
- 2980 S 225 E
- 3432 S Indian Trail
- 6049 U S 35
- 3346 SE Indian Trail Lake Rd
- 1060 W 950 S
- 1025 W 950 S
- 1380 W 950 S
- 968 W 950 S
- 985 W 950 S
- 9626 S Bloomingport Rd
- TBD W 950 S
- 936 W 950 S
- 9660 S Bloomingport Rd
- 9532 S Bloomingport Rd
- 9508 S Bloomingport Rd
- 9416 S Bloomingport Rd
- 9535 S Bloomingport Rd
- 9515 S Bloomingport Rd
- 9681 S Bloomingport Rd
- 682 W 950 S
- 682 W 950 S
- 9278 S Bloomingport Rd
- 785 W 950 S
- 9269 S Bloomingport Rd