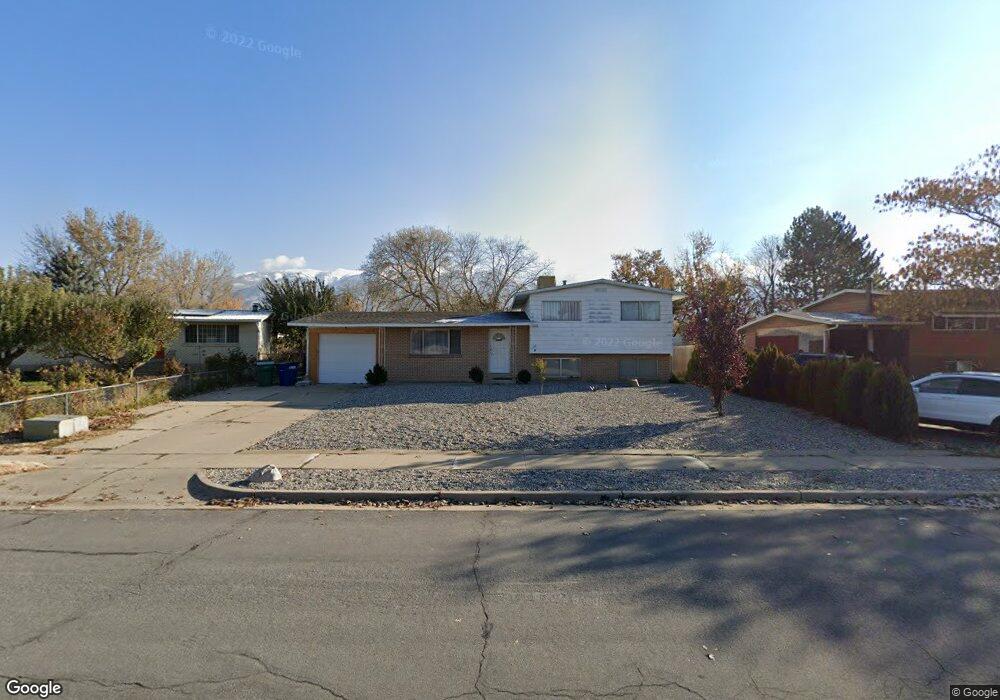
1198 N 300 E Layton, UT 84041
Estimated Value: $430,427 - $454,000
3
Beds
2
Baths
1,757
Sq Ft
$253/Sq Ft
Est. Value
About This Home
This home is located at 1198 N 300 E, Layton, UT 84041 and is currently estimated at $445,107, approximately $253 per square foot. 1198 N 300 E is a home located in Davis County with nearby schools including King Elementary School, Central Davis Junior High School, and Northridge High School.
Ownership History
Date
Name
Owned For
Owner Type
Purchase Details
Closed on
Dec 10, 1999
Sold by
Phalen Joseph A and Phalen Denise R
Bought by
Frenette John S and Frenette Allyson B
Current Estimated Value
Home Financials for this Owner
Home Financials are based on the most recent Mortgage that was taken out on this home.
Original Mortgage
$93,600
Outstanding Balance
$32,393
Interest Rate
9.5%
Estimated Equity
$412,714
Purchase Details
Closed on
Sep 26, 1997
Sold by
Beneficial Mtg Co Of Utah
Bought by
Phalen Joseph A and Phalen Denise R
Home Financials for this Owner
Home Financials are based on the most recent Mortgage that was taken out on this home.
Original Mortgage
$77,500
Interest Rate
7.44%
Purchase Details
Closed on
Sep 9, 1996
Sold by
Halliday Paul M
Bought by
Beneficial Mtg Co
Purchase Details
Closed on
Feb 14, 1996
Sold by
Ctr Properties Lc
Bought by
Lambert Kymberli J
Create a Home Valuation Report for This Property
The Home Valuation Report is an in-depth analysis detailing your home's value as well as a comparison with similar homes in the area
Home Values in the Area
Average Home Value in this Area
Purchase History
| Date | Buyer | Sale Price | Title Company |
|---|---|---|---|
| Frenette John S | -- | Security Title Company | |
| Phalen Joseph A | -- | First American Title Co | |
| Beneficial Mtg Co | $96,122 | -- | |
| Lambert Kymberli J | -- | -- |
Source: Public Records
Mortgage History
| Date | Status | Borrower | Loan Amount |
|---|---|---|---|
| Open | Frenette John S | $93,600 | |
| Previous Owner | Phalen Joseph A | $77,500 | |
| Closed | Frenette John S | $23,400 |
Source: Public Records
Tax History Compared to Growth
Tax History
| Year | Tax Paid | Tax Assessment Tax Assessment Total Assessment is a certain percentage of the fair market value that is determined by local assessors to be the total taxable value of land and additions on the property. | Land | Improvement |
|---|---|---|---|---|
| 2025 | $2,096 | $220,001 | $102,042 | $117,959 |
| 2024 | $2,039 | $215,600 | $118,897 | $96,703 |
| 2023 | $1,942 | $362,000 | $141,336 | $220,664 |
| 2022 | $1,945 | $196,900 | $74,732 | $122,168 |
| 2021 | $1,815 | $274,000 | $104,839 | $169,161 |
| 2020 | $1,643 | $238,000 | $88,210 | $149,790 |
| 2019 | $1,615 | $229,000 | $83,774 | $145,226 |
| 2018 | $1,454 | $207,000 | $83,774 | $123,226 |
| 2016 | $1,264 | $92,840 | $26,501 | $66,339 |
| 2015 | $1,165 | $81,235 | $26,501 | $54,734 |
| 2014 | $1,249 | $89,054 | $26,501 | $62,553 |
| 2013 | -- | $78,878 | $18,612 | $60,266 |
Source: Public Records
Map
Nearby Homes