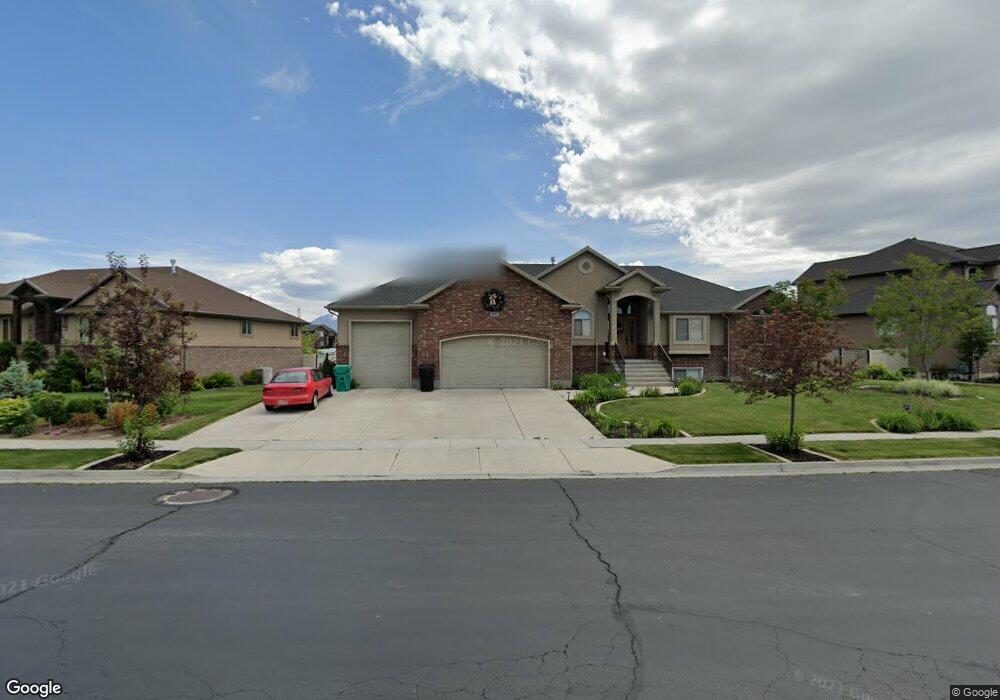
1198 St Andrews Dr Syracuse, UT 84075
Estimated Value: $686,000 - $818,000
6
Beds
3
Baths
3,566
Sq Ft
$204/Sq Ft
Est. Value
About This Home
This home is located at 1198 St Andrews Dr, Syracuse, UT 84075 and is currently estimated at $727,058, approximately $203 per square foot. 1198 St Andrews Dr is a home located in Davis County with nearby schools including Buffalo Point School, Syracuse Junior High School, and Syracuse High School.
Ownership History
Date
Name
Owned For
Owner Type
Purchase Details
Closed on
Feb 28, 2007
Sold by
Saari Albert
Bought by
Davis Jeffrey N and Davis Rhonda J
Current Estimated Value
Home Financials for this Owner
Home Financials are based on the most recent Mortgage that was taken out on this home.
Original Mortgage
$293,250
Outstanding Balance
$176,327
Interest Rate
6.23%
Mortgage Type
Purchase Money Mortgage
Estimated Equity
$550,731
Purchase Details
Closed on
Oct 17, 2006
Sold by
Lynn Glauser Construction Lc
Bought by
Lynn Glauser Construction Lc and Hadley Bryan D
Purchase Details
Closed on
Apr 11, 2006
Sold by
Lynn Glauser Construction Lc
Bought by
Saari Albert
Purchase Details
Closed on
Jul 12, 2005
Sold by
Blackburn Jones Real Estate Inc
Bought by
Lynn Glauser Construction Lc
Create a Home Valuation Report for This Property
The Home Valuation Report is an in-depth analysis detailing your home's value as well as a comparison with similar homes in the area
Home Values in the Area
Average Home Value in this Area
Purchase History
| Date | Buyer | Sale Price | Title Company |
|---|---|---|---|
| Davis Jeffrey N | -- | Backman Title Services | |
| Lynn Glauser Construction Lc | -- | Accommodation | |
| Saari Albert | -- | Accommodation | |
| Lynn Glauser Construction Lc | -- | Us Title Company Of Utah |
Source: Public Records
Mortgage History
| Date | Status | Borrower | Loan Amount |
|---|---|---|---|
| Open | Davis Jeffrey N | $293,250 |
Source: Public Records
Tax History
| Year | Tax Paid | Tax Assessment Tax Assessment Total Assessment is a certain percentage of the fair market value that is determined by local assessors to be the total taxable value of land and additions on the property. | Land | Improvement |
|---|---|---|---|---|
| 2025 | $3,842 | $370,700 | $114,258 | $256,442 |
| 2024 | $3,652 | $354,750 | $95,385 | $259,365 |
| 2023 | $3,424 | $606,000 | $140,219 | $465,781 |
| 2022 | $3,594 | $348,700 | $72,598 | $276,102 |
| 2021 | $3,269 | $491,000 | $105,546 | $385,454 |
| 2020 | $3,053 | $444,000 | $87,735 | $356,265 |
| 2019 | $2,940 | $422,000 | $90,176 | $331,824 |
| 2018 | $2,765 | $394,000 | $86,883 | $307,117 |
| 2016 | $2,602 | $194,425 | $35,138 | $159,287 |
| 2015 | $2,346 | $166,980 | $35,138 | $131,842 |
| 2014 | $2,178 | $157,962 | $35,138 | $122,824 |
| 2013 | -- | $148,773 | $32,273 | $116,500 |
Source: Public Records
Map
Nearby Homes
- 3546 Brookshire Dr
- 1430 Heather Ln
- 3736 W 1225 S
- 3867 Rungsted Cir
- 1829 S 3525 W
- 3971 W 975 S
- 2885 W 700 S
- 536 S Thurgood Ln
- 2982 S 3000 W
- 2912 S 3000 W
- 4068 W 1200 S
- 1340 S 4125 W
- 4193 W 1175 S
- 1007 S 4200 W
- 2679 W Antelope Dr
- 2584 S 2430 St W Unit 502
- 2613 S 2430 W Unit 111
- 2614 S 2430 W Unit 106
- 2665 S 2430 W Unit 118
- 2663 S 2430 W
- 1198 Saint Andrews Dr
- 1242 Saint Andrews Dr
- 3342 Saint Andrews Dr
- 1176 Saint Andrews Dr
- 3363 Saint Andrews Dr
- 3311 Cantwell Cir
- 3311 Cantwell Cir Unit 513
- 3311 Cantwell Cir Unit 513
- 1185 Saint Andrews Dr
- 1185 St Andrews Dr
- 3299 Cantwell Cir Unit 514
- 3299 Cantwell Cir
- 3324 Falkirk Rd
- 3324 Falkirk Rd Unit 518
- 1157 Saint Andrews Dr
- 1157 St Andrews Dr
- 1166 Saint Andrews Dr
- 3349 Saint Andrews Dr
- 3298 Falkirk Rd
- 3298 Falkirk Rd Unit 517
Your Personal Tour Guide
Ask me questions while you tour the home.