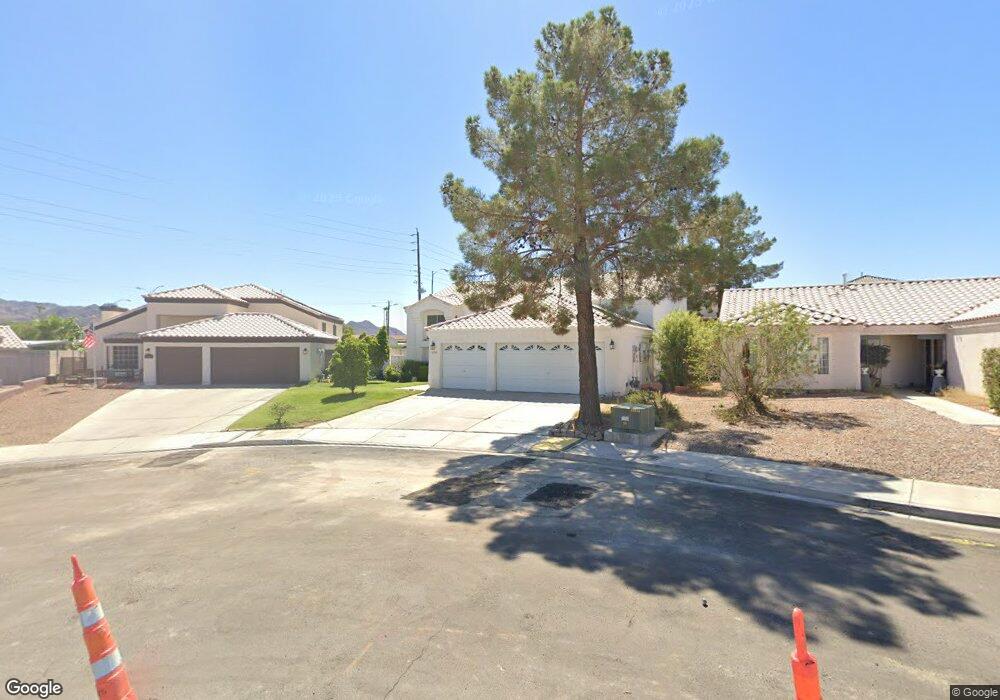
1199 Expectation Ct Henderson, NV 89002
River Mountain NeighborhoodEstimated Value: $502,000 - $552,000
6
Beds
3
Baths
2,362
Sq Ft
$218/Sq Ft
Est. Value
About This Home
This home is located at 1199 Expectation Ct, Henderson, NV 89002 and is currently estimated at $515,111, approximately $218 per square foot. 1199 Expectation Ct is a home located in Clark County with nearby schools including John Dooley Elementary School, B Mahlon Brown Academy of International Studies, and Basic Academy of International Studies.
Ownership History
Date
Name
Owned For
Owner Type
Purchase Details
Closed on
Mar 23, 2007
Sold by
Hobbs Anna M
Bought by
Hobbs Anna M
Current Estimated Value
Home Financials for this Owner
Home Financials are based on the most recent Mortgage that was taken out on this home.
Original Mortgage
$202,050
Outstanding Balance
$121,291
Interest Rate
6.11%
Mortgage Type
New Conventional
Estimated Equity
$393,820
Purchase Details
Closed on
Apr 19, 1996
Sold by
Whittaker Loretta E and Lopez Loretta
Bought by
Hobbs Curtis L and Hobbs Anna M
Purchase Details
Closed on
Mar 29, 1993
Sold by
Magic Canyon Homes Ltd
Bought by
Hobbs Curtis L and Hobbs Anna M
Home Financials for this Owner
Home Financials are based on the most recent Mortgage that was taken out on this home.
Original Mortgage
$160,680
Interest Rate
8.1%
Mortgage Type
VA
Create a Home Valuation Report for This Property
The Home Valuation Report is an in-depth analysis detailing your home's value as well as a comparison with similar homes in the area
Home Values in the Area
Average Home Value in this Area
Purchase History
| Date | Buyer | Sale Price | Title Company |
|---|---|---|---|
| Hobbs Anna M | -- | Title Source Inc | |
| Hobbs Curtis L | -- | -- | |
| Hobbs Curtis L | $156,000 | Old Republic Title Company |
Source: Public Records
Mortgage History
| Date | Status | Borrower | Loan Amount |
|---|---|---|---|
| Open | Hobbs Anna M | $202,050 | |
| Previous Owner | Hobbs Curtis L | $160,680 |
Source: Public Records
Tax History Compared to Growth
Tax History
| Year | Tax Paid | Tax Assessment Tax Assessment Total Assessment is a certain percentage of the fair market value that is determined by local assessors to be the total taxable value of land and additions on the property. | Land | Improvement |
|---|---|---|---|---|
| 2025 | $2,033 | $100,821 | $28,000 | $72,821 |
| 2024 | $1,974 | $100,821 | $28,000 | $72,821 |
| 2023 | $1,582 | $103,504 | $33,950 | $69,554 |
| 2022 | $1,919 | $92,595 | $28,700 | $63,895 |
| 2021 | $1,864 | $87,530 | $26,600 | $60,930 |
| 2020 | $1,807 | $87,219 | $26,600 | $60,619 |
| 2019 | $1,755 | $79,728 | $19,600 | $60,128 |
| 2018 | $1,670 | $75,126 | $18,550 | $56,576 |
| 2017 | $2,181 | $76,569 | $18,200 | $58,369 |
| 2016 | $1,582 | $68,488 | $9,800 | $58,688 |
| 2015 | $1,581 | $59,748 | $9,800 | $49,948 |
| 2014 | $1,532 | $54,308 | $9,100 | $45,208 |
Source: Public Records
Map
Nearby Homes
- 2050 S Magic Way Unit 192
- 2050 S Magic Way Unit 181
- 2050 S Magic Way Unit 20
- 2050 S Magic Way Unit 220
- 2050 S Magic Way Unit 271
- 2050 S Magic Way Unit 210
- 2050 S Magic Way Unit 66
- 2050 S Magic Way Unit 201
- 2050 S Magic Way Unit 26
- 2050 S Magic Way Unit 203
- 2050 S Magic Way Unit 290
- 2050 S Magic Way Unit 176
- 1126 Langston Ranch Ave
- 1082 Langston Ranch Ave
- 1916 Chickasaw Dr
- 730 Booted Eagle St
- 1290 Dalene Ave
- 732 Goshawk St
- 717 Triple Crown St
- 617 Sylvan St
- 1195 Expectation Ct
- 1940 Magic Canyon Dr
- 1936 Magic Canyon Dr
- 1191 Expectation Ct
- 1196 Abracadabra Ave
- 1932 Magic Canyon Dr
- 1194 Expectation Ct
- 1192 Abracadabra Ave
- 2008 Houdini St
- 1190 Expectation Ct
- 1188 Abracadabra Ave
- 1928 Magic Canyon Dr
- 1186 Expectation Ct
- 2012 Houdini St
- 1183 Expectation Ct
- 1195 King Arthur Ct
- 1980 S Magic Way
- 1970 S Magic Way
- 1924 Magic Canyon Dr
- 1191 King Arthur Ct