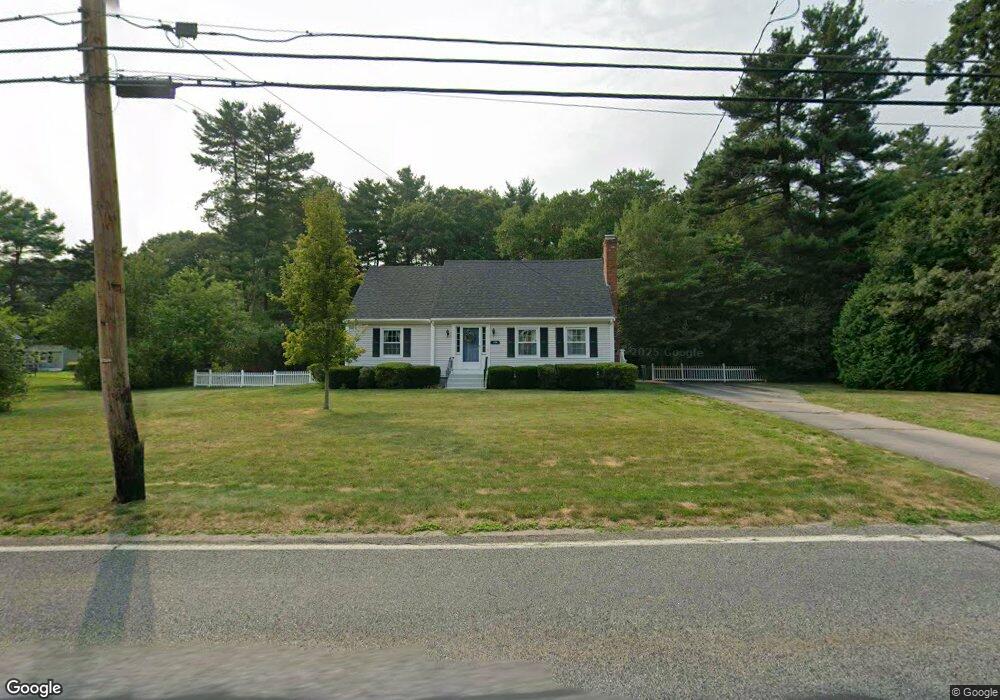
1199 West St Mansfield, MA 02048
Estimated Value: $669,822 - $700,000
5
Beds
2
Baths
1,901
Sq Ft
$360/Sq Ft
Est. Value
About This Home
This home is located at 1199 West St, Mansfield, MA 02048 and is currently estimated at $685,206, approximately $360 per square foot. 1199 West St is a home located in Bristol County with nearby schools including Everett W. Robinson Elementary School, Jordan/Jackson Elementary School, and Harold L. Qualters Middle School.
Ownership History
Date
Name
Owned For
Owner Type
Purchase Details
Closed on
Mar 30, 2017
Sold by
Oser Michael J and Oser Donna M
Bought by
Oser Ft
Current Estimated Value
Purchase Details
Closed on
Mar 20, 1989
Sold by
Hebard Gregory
Bought by
Oser Michael J
Home Financials for this Owner
Home Financials are based on the most recent Mortgage that was taken out on this home.
Original Mortgage
$150,000
Interest Rate
10.46%
Mortgage Type
Purchase Money Mortgage
Create a Home Valuation Report for This Property
The Home Valuation Report is an in-depth analysis detailing your home's value as well as a comparison with similar homes in the area
Home Values in the Area
Average Home Value in this Area
Purchase History
| Date | Buyer | Sale Price | Title Company |
|---|---|---|---|
| Oser Ft | -- | -- | |
| Oser Michael J | $169,000 | -- |
Source: Public Records
Mortgage History
| Date | Status | Borrower | Loan Amount |
|---|---|---|---|
| Previous Owner | Oser Michael J | $120,000 | |
| Previous Owner | Oser Michael J | $130,500 | |
| Previous Owner | Oser Michael J | $150,000 | |
| Previous Owner | Oser Michael J | $93,000 |
Source: Public Records
Tax History Compared to Growth
Tax History
| Year | Tax Paid | Tax Assessment Tax Assessment Total Assessment is a certain percentage of the fair market value that is determined by local assessors to be the total taxable value of land and additions on the property. | Land | Improvement |
|---|---|---|---|---|
| 2025 | $6,892 | $523,300 | $241,800 | $281,500 |
| 2024 | $7,104 | $526,200 | $241,800 | $284,400 |
| 2023 | $7,030 | $498,900 | $241,800 | $257,100 |
| 2022 | $6,776 | $446,700 | $223,800 | $222,900 |
| 2021 | $6,881 | $410,900 | $195,900 | $215,000 |
| 2020 | $3,850 | $385,300 | $186,600 | $198,700 |
| 2019 | $5,493 | $360,900 | $155,400 | $205,500 |
| 2018 | $6,334 | $348,100 | $148,200 | $199,900 |
| 2017 | $4,886 | $325,300 | $144,000 | $181,300 |
| 2016 | $4,675 | $303,400 | $137,100 | $166,300 |
| 2015 | $4,645 | $299,700 | $137,100 | $162,600 |
Source: Public Records
Map
Nearby Homes