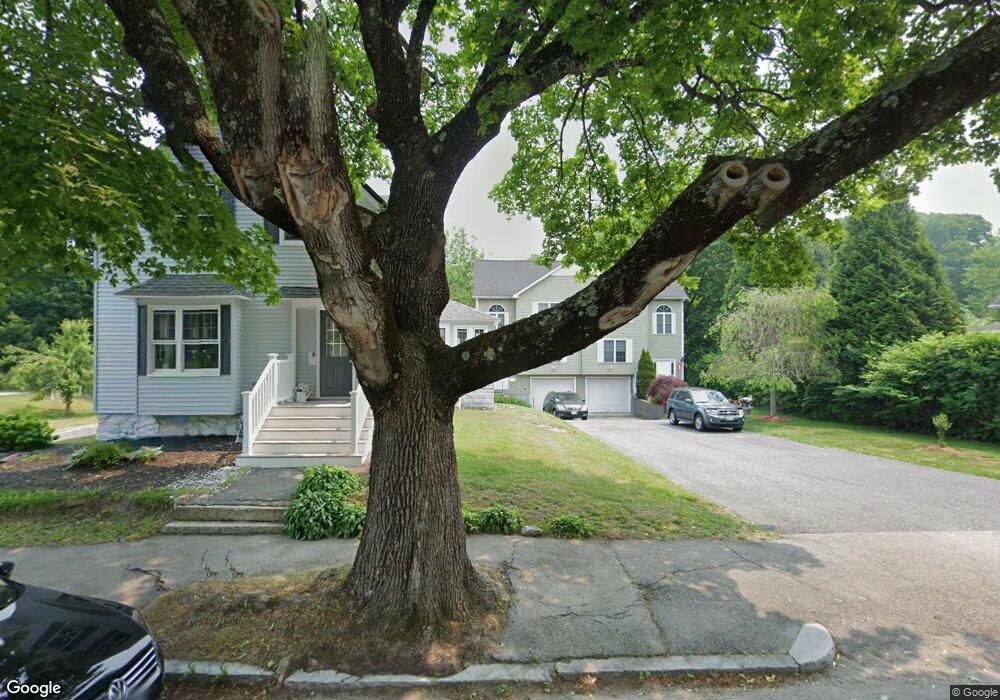
11A Anderson Ave Worcester, MA 01604
Grafton Hill NeighborhoodEstimated Value: $429,000 - $481,000
3
Beds
2
Baths
1,592
Sq Ft
$285/Sq Ft
Est. Value
About This Home
This home is located at 11A Anderson Ave, Worcester, MA 01604 and is currently estimated at $453,494, approximately $284 per square foot. 11A Anderson Ave is a home located in Worcester County with nearby schools including Jacob Hiatt Magnet School, Chandler Magnet, and Lake View Elementary School.
Ownership History
Date
Name
Owned For
Owner Type
Purchase Details
Closed on
Jun 26, 2007
Sold by
Lehman Ann M and Rittinger William J
Bought by
Gibbons Bernadette F
Current Estimated Value
Home Financials for this Owner
Home Financials are based on the most recent Mortgage that was taken out on this home.
Original Mortgage
$187,200
Interest Rate
6.14%
Mortgage Type
Purchase Money Mortgage
Purchase Details
Closed on
Aug 8, 2003
Sold by
Drew Kimberly and Harney Kimberly
Bought by
Meola Dev Corp
Home Financials for this Owner
Home Financials are based on the most recent Mortgage that was taken out on this home.
Original Mortgage
$264,300
Interest Rate
5.28%
Mortgage Type
Purchase Money Mortgage
Purchase Details
Closed on
Jun 30, 1998
Sold by
Beahn Raymond E and Macaruso Nancy M
Bought by
Harney Thomas and Harney Kimberly
Home Financials for this Owner
Home Financials are based on the most recent Mortgage that was taken out on this home.
Original Mortgage
$85,100
Interest Rate
7.09%
Mortgage Type
Purchase Money Mortgage
Create a Home Valuation Report for This Property
The Home Valuation Report is an in-depth analysis detailing your home's value as well as a comparison with similar homes in the area
Home Values in the Area
Average Home Value in this Area
Purchase History
| Date | Buyer | Sale Price | Title Company |
|---|---|---|---|
| Gibbons Bernadette F | $234,000 | -- | |
| Meola Dev Corp | $255,000 | -- | |
| Harney Thomas | $113,500 | -- |
Source: Public Records
Mortgage History
| Date | Status | Borrower | Loan Amount |
|---|---|---|---|
| Open | Harney Thomas | $186,400 | |
| Closed | Gibbons Bernadette F | $187,200 | |
| Previous Owner | Meola Dev Corp | $264,300 | |
| Previous Owner | Harney Thomas | $25,000 | |
| Previous Owner | Harney Thomas | $4,198 | |
| Previous Owner | Harney Thomas | $85,100 |
Source: Public Records
Tax History
| Year | Tax Paid | Tax Assessment Tax Assessment Total Assessment is a certain percentage of the fair market value that is determined by local assessors to be the total taxable value of land and additions on the property. | Land | Improvement |
|---|---|---|---|---|
| 2025 | $5,556 | $421,200 | $102,700 | $318,500 |
| 2024 | $5,310 | $386,200 | $102,700 | $283,500 |
| 2023 | $5,042 | $351,600 | $89,300 | $262,300 |
| 2022 | $4,578 | $301,000 | $71,400 | $229,600 |
| 2021 | $4,583 | $281,500 | $57,200 | $224,300 |
| 2020 | $4,500 | $264,700 | $57,100 | $207,600 |
| 2019 | $4,331 | $240,600 | $51,400 | $189,200 |
| 2018 | $4,332 | $229,100 | $51,400 | $177,700 |
| 2017 | $3,842 | $199,900 | $51,400 | $148,500 |
| 2016 | $3,689 | $179,000 | $38,500 | $140,500 |
| 2015 | $3,593 | $179,000 | $38,500 | $140,500 |
| 2014 | $3,498 | $179,000 | $38,500 | $140,500 |
Source: Public Records
Map
Nearby Homes
- 360 Hamilton St
- Lot B Crawford St
- 19 Middlesex Ave
- 21 Middlesex Ave Unit 102
- 496 Hamilton St
- 41 Modoc St
- 12 Benham St
- 143 Dorcester
- 80 Delmont Ave
- 143 Commonwealth Ave
- 155 Hamilton St Unit 4
- 28 Nonquit St
- 16 Arborwood Dr
- 34 Robin Rd
- 293 Harrington Way
- 241 Lake Ave
- 365 Lake Ave
- 24 Ingleside Ave
- 83 Massasoit Rd
- 115 Orient St
- 11B Anderson Ave
- 11 Anderson Ave
- 9 Anderson Ave
- 13 Anderson Ave
- 20 Harold St
- 22 Harold St
- 7 Anderson Ave
- 17 Anderson Ave
- 17 Anderson Ave Unit 1
- 24 Harold St
- 16 Harold St
- 19 Anderson Ave
- 26 Harold St
- 26 Harold St
- 16 Anderson Ave
- 5 Anderson Ave
- 10 Anderson Ave
- 21 Anderson Ave
- 20 Anderson Ave
- 28 Harold St
Your Personal Tour Guide
Ask me questions while you tour the home.