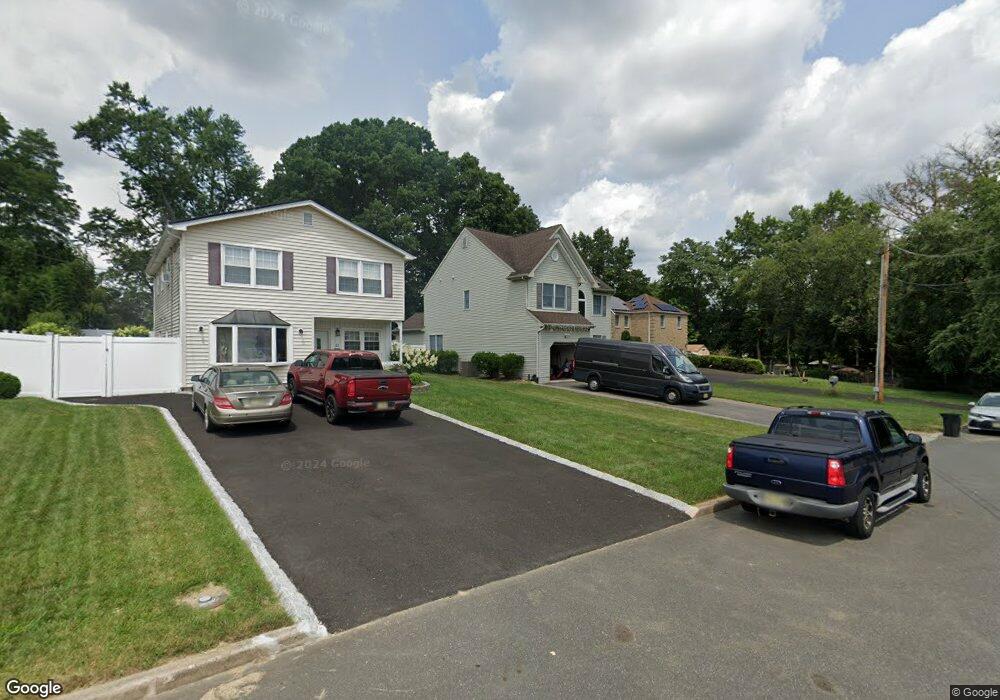
11B Michael St Jamesburg, NJ 08831
Estimated Value: $607,000 - $690,000
--
Bed
--
Bath
2,134
Sq Ft
$303/Sq Ft
Est. Value
About This Home
This home is located at 11B Michael St, Jamesburg, NJ 08831 and is currently estimated at $646,787, approximately $303 per square foot. 11B Michael St is a home located in Middlesex County with nearby schools including John F. Kennedy Elementary School, Grace M. Breckwedel Middle School, and Immaculate Conception School.
Ownership History
Date
Name
Owned For
Owner Type
Purchase Details
Closed on
May 24, 2002
Sold by
Losada George
Bought by
Szajdecki John
Current Estimated Value
Home Financials for this Owner
Home Financials are based on the most recent Mortgage that was taken out on this home.
Original Mortgage
$228,000
Outstanding Balance
$96,208
Interest Rate
6.92%
Estimated Equity
$550,579
Purchase Details
Closed on
May 25, 2001
Sold by
Fizer John
Bought by
Losada Ii George and Mollica John
Create a Home Valuation Report for This Property
The Home Valuation Report is an in-depth analysis detailing your home's value as well as a comparison with similar homes in the area
Home Values in the Area
Average Home Value in this Area
Purchase History
| Date | Buyer | Sale Price | Title Company |
|---|---|---|---|
| Szajdecki John | $285,000 | -- | |
| Losada Ii George | $75,900 | -- | |
| Losada Ii George | $75,900 | -- |
Source: Public Records
Mortgage History
| Date | Status | Borrower | Loan Amount |
|---|---|---|---|
| Open | Szajdecki John | $228,000 |
Source: Public Records
Tax History Compared to Growth
Tax History
| Year | Tax Paid | Tax Assessment Tax Assessment Total Assessment is a certain percentage of the fair market value that is determined by local assessors to be the total taxable value of land and additions on the property. | Land | Improvement |
|---|---|---|---|---|
| 2025 | $11,607 | $168,900 | $43,700 | $125,200 |
| 2024 | $11,223 | $168,900 | $43,700 | $125,200 |
| 2023 | $11,223 | $168,900 | $43,700 | $125,200 |
| 2022 | $11,117 | $168,900 | $43,700 | $125,200 |
| 2021 | $10,874 | $168,900 | $43,700 | $125,200 |
| 2020 | $10,781 | $168,900 | $43,700 | $125,200 |
| 2019 | $10,776 | $168,900 | $43,700 | $125,200 |
| 2018 | $10,664 | $168,900 | $43,700 | $125,200 |
| 2017 | $10,587 | $168,900 | $43,700 | $125,200 |
| 2016 | $10,511 | $168,900 | $43,700 | $125,200 |
| 2015 | $10,227 | $168,900 | $43,700 | $125,200 |
| 2014 | $9,771 | $168,900 | $43,700 | $125,200 |
Source: Public Records
Map
Nearby Homes