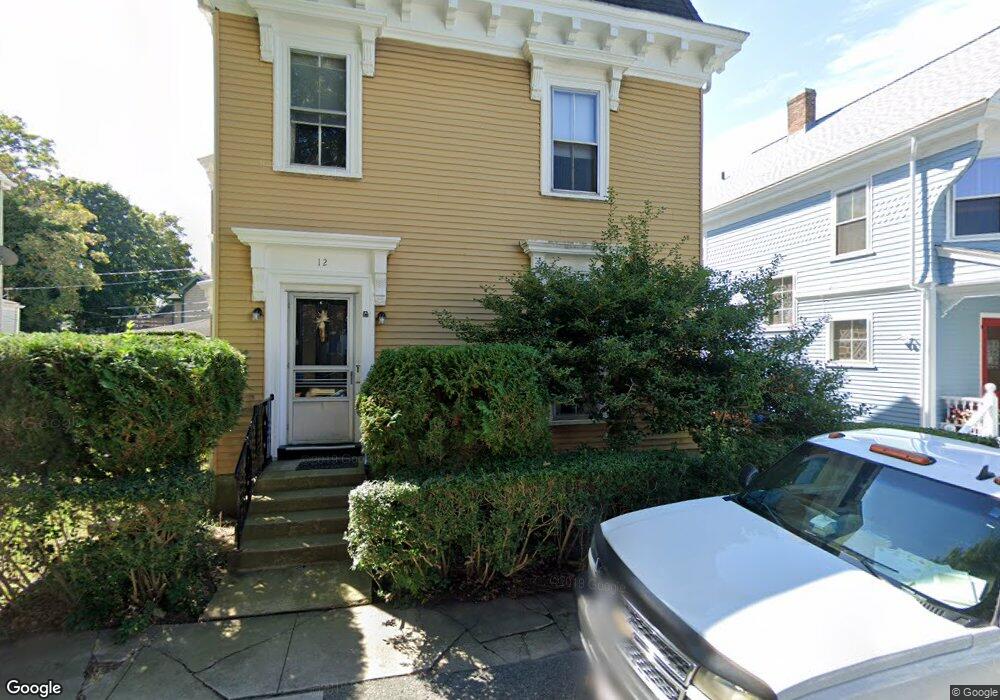
12 1/2 Park St Newport, RI 02840
Estimated Value: $929,000 - $998,423
5
Beds
3
Baths
1,751
Sq Ft
$551/Sq Ft
Est. Value
About This Home
This home is located at 12 1/2 Park St, Newport, RI 02840 and is currently estimated at $965,606, approximately $551 per square foot. 12 1/2 Park St is a home located in Newport County with nearby schools including Rogers High School, St Michael's Country Day School, and St George's School.
Ownership History
Date
Name
Owned For
Owner Type
Purchase Details
Closed on
Aug 16, 2019
Sold by
Johnson Chad P
Bought by
Conley Norma J and Conley William J
Current Estimated Value
Home Financials for this Owner
Home Financials are based on the most recent Mortgage that was taken out on this home.
Original Mortgage
$450,000
Outstanding Balance
$394,117
Interest Rate
3.7%
Mortgage Type
New Conventional
Estimated Equity
$571,489
Purchase Details
Closed on
Apr 9, 2009
Sold by
Benson Nicholas and Benson Alexandra
Bought by
Sullivan George T
Home Financials for this Owner
Home Financials are based on the most recent Mortgage that was taken out on this home.
Original Mortgage
$280,000
Interest Rate
4.94%
Mortgage Type
Purchase Money Mortgage
Create a Home Valuation Report for This Property
The Home Valuation Report is an in-depth analysis detailing your home's value as well as a comparison with similar homes in the area
Home Values in the Area
Average Home Value in this Area
Purchase History
| Date | Buyer | Sale Price | Title Company |
|---|---|---|---|
| Conley Norma J | $500,000 | -- | |
| Sullivan George T | $350,000 | -- |
Source: Public Records
Mortgage History
| Date | Status | Borrower | Loan Amount |
|---|---|---|---|
| Open | Conley Norma J | $450,000 | |
| Previous Owner | Sullivan George T | $280,000 | |
| Previous Owner | Sullivan George T | $115,500 |
Source: Public Records
Tax History Compared to Growth
Tax History
| Year | Tax Paid | Tax Assessment Tax Assessment Total Assessment is a certain percentage of the fair market value that is determined by local assessors to be the total taxable value of land and additions on the property. | Land | Improvement |
|---|---|---|---|---|
| 2025 | $7,370 | $848,200 | $170,600 | $677,600 |
| 2024 | $6,972 | $848,200 | $170,600 | $677,600 |
| 2023 | $5,070 | $511,100 | $110,600 | $400,500 |
| 2022 | $4,806 | $500,100 | $110,600 | $389,500 |
| 2021 | $4,666 | $500,100 | $110,600 | $389,500 |
| 2020 | $3,663 | $356,300 | $96,700 | $259,600 |
| 2019 | $3,663 | $356,300 | $96,700 | $259,600 |
| 2018 | $3,559 | $356,300 | $96,700 | $259,600 |
| 2017 | $3,524 | $314,400 | $74,300 | $240,100 |
| 2016 | $3,436 | $314,400 | $74,300 | $240,100 |
| 2015 | $3,355 | $314,400 | $74,300 | $240,100 |
| 2014 | $3,581 | $296,900 | $66,500 | $230,400 |
Source: Public Records
Map
Nearby Homes
- 4 Newport Ave Unit B2
- 53 Warner St
- 5 Bowser Ct
- 44 Warner St
- 17 Lincoln St
- 3 Vicksburg Place
- 125 Van Zandt Ave Unit 307
- 102 Broadway Unit 2B
- 1 Arnold Ave
- 155 Evarts St
- 23 Mann Ave Unit 4
- 27 Soar Way
- 42 Mann Ave
- 7 Sheffield Ave
- 78 Rhode Island Ave Unit 6
- 78 Rhode Island Ave Unit 8
- 31 Coddington St Unit 24
- 12 Poplar St
- 1 Pell St
- 5 Pell St