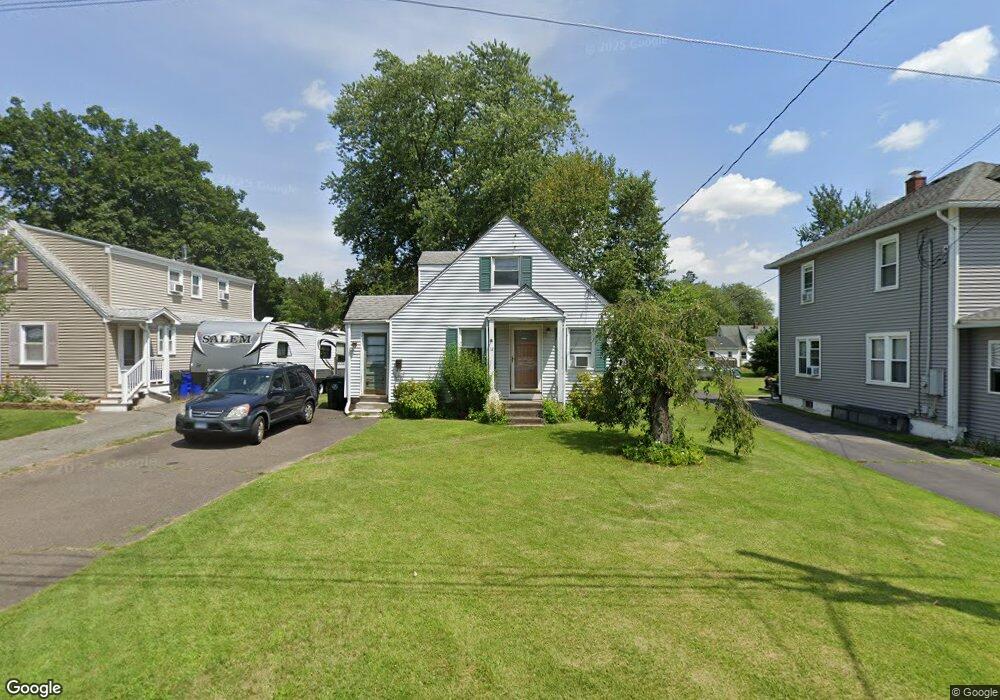
12 3rd St Windsor Locks, CT 06096
Estimated Value: $269,000 - $316,000
3
Beds
2
Baths
1,155
Sq Ft
$254/Sq Ft
Est. Value
About This Home
This home is located at 12 3rd St, Windsor Locks, CT 06096 and is currently estimated at $293,867, approximately $254 per square foot. 12 3rd St is a home located in Hartford County with nearby schools including North Street School, South Elementary School, and Windsor Locks Middle School.
Ownership History
Date
Name
Owned For
Owner Type
Purchase Details
Closed on
Oct 24, 2005
Sold by
Werth Timothy and Werth Lindsay
Bought by
Campbell Steven and Campbell Cynthia
Current Estimated Value
Home Financials for this Owner
Home Financials are based on the most recent Mortgage that was taken out on this home.
Original Mortgage
$105,000
Outstanding Balance
$56,059
Interest Rate
5.72%
Estimated Equity
$237,808
Purchase Details
Closed on
May 14, 2002
Sold by
Mckinstry Julie
Bought by
Werth Timothy and Thompson Lindsay
Home Financials for this Owner
Home Financials are based on the most recent Mortgage that was taken out on this home.
Original Mortgage
$127,000
Interest Rate
7.18%
Purchase Details
Closed on
Jan 29, 1996
Sold by
Doustou Rita Est
Bought by
Mckinstry Julie and Veit Charles
Home Financials for this Owner
Home Financials are based on the most recent Mortgage that was taken out on this home.
Original Mortgage
$92,434
Interest Rate
7.13%
Mortgage Type
Unknown
Create a Home Valuation Report for This Property
The Home Valuation Report is an in-depth analysis detailing your home's value as well as a comparison with similar homes in the area
Home Values in the Area
Average Home Value in this Area
Purchase History
| Date | Buyer | Sale Price | Title Company |
|---|---|---|---|
| Campbell Steven | $180,000 | -- | |
| Werth Timothy | $129,000 | -- | |
| Mckinstry Julie | $92,500 | -- |
Source: Public Records
Mortgage History
| Date | Status | Borrower | Loan Amount |
|---|---|---|---|
| Open | Mckinstry Julie | $105,000 | |
| Previous Owner | Mckinstry Julie | $134,000 | |
| Previous Owner | Mckinstry Julie | $127,000 | |
| Previous Owner | Mckinstry Julie | $92,434 |
Source: Public Records
Tax History
| Year | Tax Paid | Tax Assessment Tax Assessment Total Assessment is a certain percentage of the fair market value that is determined by local assessors to be the total taxable value of land and additions on the property. | Land | Improvement |
|---|---|---|---|---|
| 2025 | $4,139 | $172,550 | $50,680 | $121,870 |
| 2024 | $2,752 | $97,790 | $32,760 | $65,030 |
| 2023 | $2,575 | $97,790 | $32,760 | $65,030 |
| 2022 | $2,526 | $97,790 | $32,760 | $65,030 |
| 2021 | $2,526 | $97,790 | $32,760 | $65,030 |
| 2020 | $2,526 | $97,790 | $32,760 | $65,030 |
| 2019 | $2,526 | $97,790 | $32,760 | $65,030 |
| 2017 | $2,613 | $98,000 | $35,400 | $62,600 |
| 2016 | $2,613 | $98,000 | $35,400 | $62,600 |
| 2015 | $2,625 | $98,000 | $35,400 | $62,600 |
| 2014 | $3,035 | $115,700 | $40,200 | $75,500 |
Source: Public Records
Map
Nearby Homes
- 102 Orchard Hill Dr
- 59 Elm St
- 124 Bel-Aire Cir
- 24 Bel-Aire Cir
- 140 S Water St
- 19 Dean Ave
- 94 Raymond Rd
- 241 S Water St Unit 11
- 241 S Water St Unit 14
- 202 Reed Ave
- 64 Main St
- 0 N Water St Unit 24138494
- 0 N Water St Unit 24128295
- 0 N Water St Unit 24128294
- 0 N Water St Unit 24128288
- 0 N Water St
- 80 West St
- 22 Suffield St
- 15 Suffield St
- 143 Bridge St
Your Personal Tour Guide
Ask me questions while you tour the home.