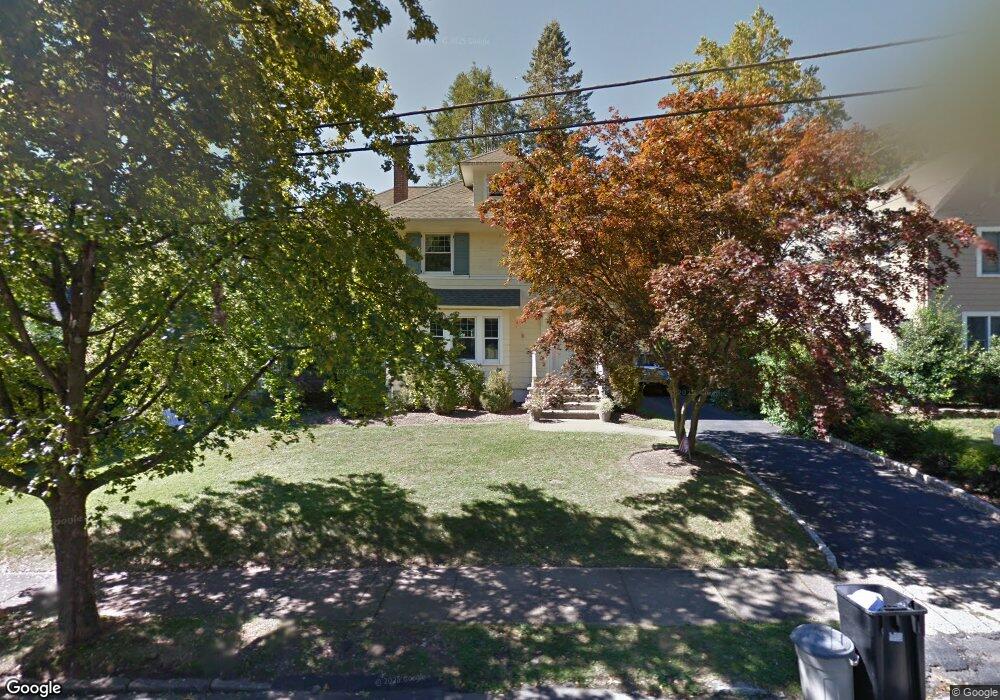
12 Academy Rd Madison, NJ 07940
Estimated Value: $1,293,338 - $1,665,000
--
Bed
--
Bath
2,316
Sq Ft
$645/Sq Ft
Est. Value
About This Home
This home is located at 12 Academy Rd, Madison, NJ 07940 and is currently estimated at $1,493,335, approximately $644 per square foot. 12 Academy Rd is a home located in Morris County with nearby schools including Torey J. Sabatini School, Madison Junior School, and Madison High School.
Ownership History
Date
Name
Owned For
Owner Type
Purchase Details
Closed on
Apr 19, 2004
Sold by
National Residential Nominee S
Bought by
Flanagan Sean and Kinney Michelle
Current Estimated Value
Home Financials for this Owner
Home Financials are based on the most recent Mortgage that was taken out on this home.
Original Mortgage
$627,900
Outstanding Balance
$289,285
Interest Rate
5.36%
Estimated Equity
$1,204,050
Purchase Details
Closed on
Feb 11, 2004
Sold by
Philips Craig
Bought by
National Residential Nominee S
Create a Home Valuation Report for This Property
The Home Valuation Report is an in-depth analysis detailing your home's value as well as a comparison with similar homes in the area
Home Values in the Area
Average Home Value in this Area
Purchase History
| Date | Buyer | Sale Price | Title Company |
|---|---|---|---|
| Flanagan Sean | $784,900 | -- | |
| National Residential Nominee S | $784,900 | -- |
Source: Public Records
Mortgage History
| Date | Status | Borrower | Loan Amount |
|---|---|---|---|
| Open | Flanagan Sean | $627,900 |
Source: Public Records
Tax History Compared to Growth
Tax History
| Year | Tax Paid | Tax Assessment Tax Assessment Total Assessment is a certain percentage of the fair market value that is determined by local assessors to be the total taxable value of land and additions on the property. | Land | Improvement |
|---|---|---|---|---|
| 2025 | $17,285 | $811,500 | $411,000 | $400,500 |
| 2024 | $16,709 | $811,500 | $411,000 | $400,500 |
| 2023 | $16,709 | $811,500 | $411,000 | $400,500 |
| 2022 | $16,441 | $811,500 | $411,000 | $400,500 |
| 2021 | $16,441 | $811,500 | $411,000 | $400,500 |
| 2020 | $16,271 | $811,500 | $411,000 | $400,500 |
| 2019 | $16,011 | $811,500 | $411,000 | $400,500 |
| 2018 | $15,605 | $811,500 | $411,000 | $400,500 |
| 2017 | $15,483 | $811,500 | $411,000 | $400,500 |
| 2016 | $15,216 | $811,500 | $411,000 | $400,500 |
| 2015 | $14,932 | $807,300 | $411,000 | $396,300 |
| 2014 | $14,354 | $807,300 | $411,000 | $396,300 |
Source: Public Records
Map
Nearby Homes