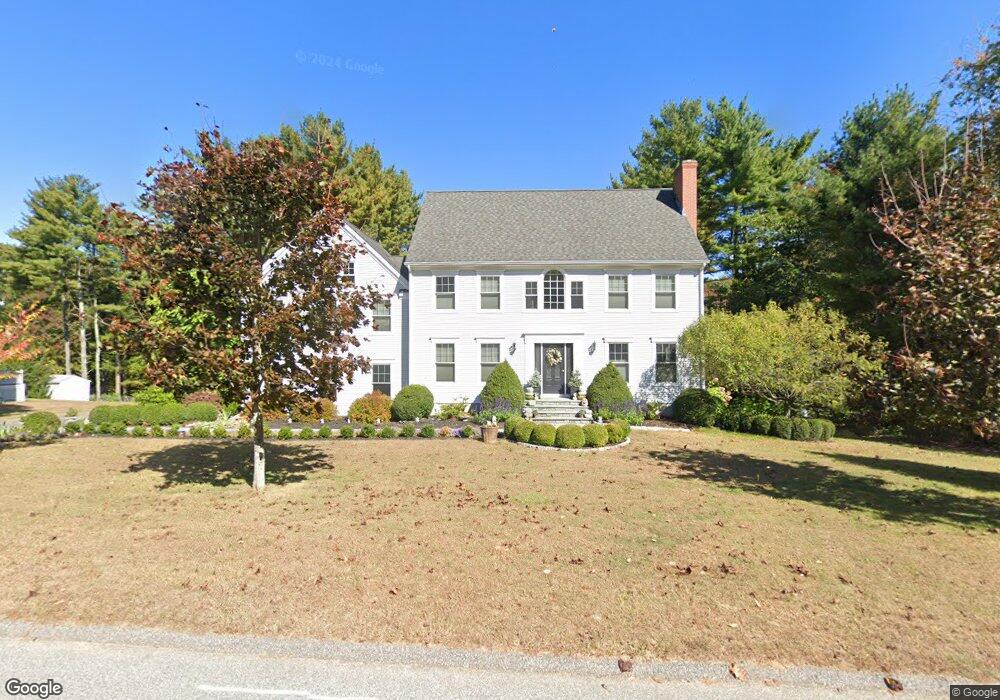
12 Acorn Dr East Haddam, CT 06423
Estimated Value: $552,000 - $685,891
3
Beds
3
Baths
2,704
Sq Ft
$226/Sq Ft
Est. Value
About This Home
This home is located at 12 Acorn Dr, East Haddam, CT 06423 and is currently estimated at $611,223, approximately $226 per square foot. 12 Acorn Dr is a home located in Middlesex County with nearby schools including East Haddam Elementary School, Nathan Hale-Ray Middle School, and Nathan Hale-Ray High School.
Ownership History
Date
Name
Owned For
Owner Type
Purchase Details
Closed on
Jul 30, 2007
Sold by
Gometz Ralph
Bought by
Swinson Christopher and Swinson Lori Ann
Current Estimated Value
Home Financials for this Owner
Home Financials are based on the most recent Mortgage that was taken out on this home.
Original Mortgage
$343,640
Outstanding Balance
$217,907
Interest Rate
6.78%
Estimated Equity
$393,316
Create a Home Valuation Report for This Property
The Home Valuation Report is an in-depth analysis detailing your home's value as well as a comparison with similar homes in the area
Home Values in the Area
Average Home Value in this Area
Purchase History
| Date | Buyer | Sale Price | Title Company |
|---|---|---|---|
| Swinson Christopher | $429,550 | -- |
Source: Public Records
Mortgage History
| Date | Status | Borrower | Loan Amount |
|---|---|---|---|
| Open | Swinson Christopher | $343,640 | |
| Closed | Swinson Christopher | $85,300 |
Source: Public Records
Tax History Compared to Growth
Tax History
| Year | Tax Paid | Tax Assessment Tax Assessment Total Assessment is a certain percentage of the fair market value that is determined by local assessors to be the total taxable value of land and additions on the property. | Land | Improvement |
|---|---|---|---|---|
| 2025 | $8,938 | $318,540 | $79,070 | $239,470 |
| 2024 | $8,524 | $318,540 | $79,070 | $239,470 |
| 2023 | $8,202 | $318,540 | $79,070 | $239,470 |
| 2022 | $7,794 | $245,160 | $57,980 | $187,180 |
| 2021 | $7,463 | $245,160 | $57,980 | $187,180 |
| 2020 | $7,463 | $245,160 | $57,980 | $187,180 |
| 2019 | $7,463 | $245,160 | $57,980 | $187,180 |
| 2018 | $7,271 | $245,160 | $57,980 | $187,180 |
| 2017 | $7,159 | $242,030 | $67,450 | $174,580 |
| 2016 | $7,104 | $242,030 | $67,450 | $174,580 |
| 2015 | $6,941 | $242,030 | $67,450 | $174,580 |
| 2014 | $6,753 | $242,060 | $67,480 | $174,580 |
Source: Public Records
Map
Nearby Homes
- 2 Acorn Dr
- 53 Shanaghans Rd
- 16 Mount Parnassus Rd
- 55 Bogel Rd
- 00 Mount Parnassus Rd
- 206 Sheepskin Hollow Rd
- 7 Shelter Rock Rd
- 0 Lakeside Dr
- 11 Phelps Rd
- 0 Florida Rd
- 63 Schulman Veslak Rd
- 45 Alger Rd
- 2 Norwich Rd
- 23 Main St
- 80 Orchard Rd
- 253 Clark Hill Rd
- 10 Orchard Rd
- 114 Lakeside Dr
- 496 Joshuatown Rd
- 112 Schulman Veslak Rd