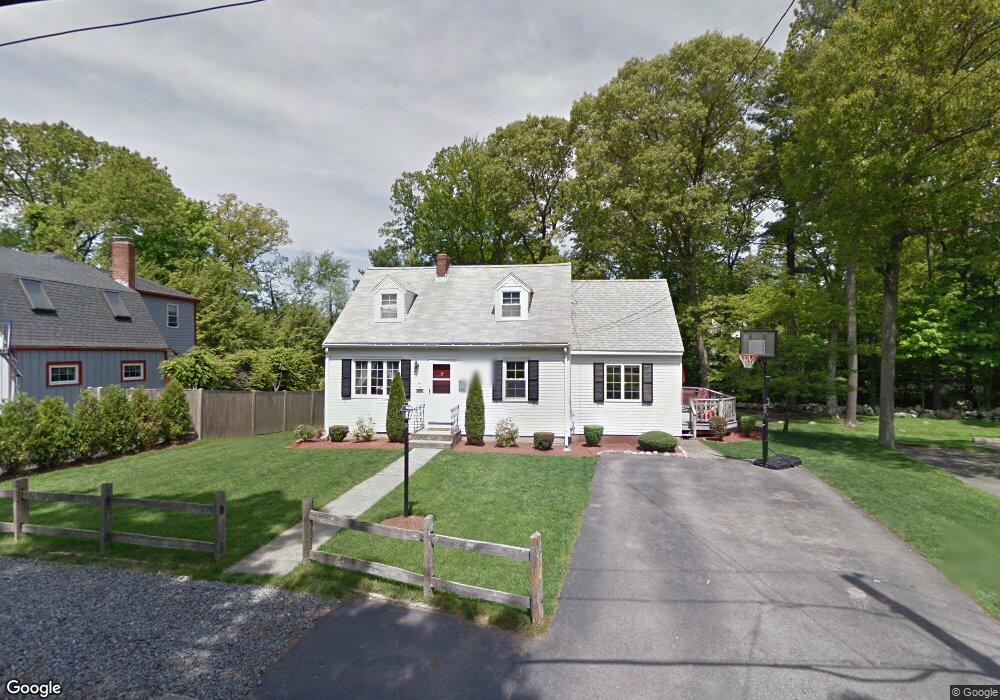
12 Adorn St Weymouth, MA 02188
South Weymouth NeighborhoodEstimated Value: $613,680 - $670,000
3
Beds
2
Baths
1,440
Sq Ft
$446/Sq Ft
Est. Value
About This Home
This home is located at 12 Adorn St, Weymouth, MA 02188 and is currently estimated at $642,670, approximately $446 per square foot. 12 Adorn St is a home located in Norfolk County with nearby schools including Frederick C Murphy, Abigail Adams Middle School, and Weymouth Middle School Chapman.
Ownership History
Date
Name
Owned For
Owner Type
Purchase Details
Closed on
Jul 1, 2005
Sold by
Price Geroge W and Price Norma J
Bought by
Folan David K and Folan Karen P
Current Estimated Value
Home Financials for this Owner
Home Financials are based on the most recent Mortgage that was taken out on this home.
Original Mortgage
$278,400
Outstanding Balance
$145,985
Interest Rate
5.73%
Mortgage Type
Purchase Money Mortgage
Estimated Equity
$496,685
Create a Home Valuation Report for This Property
The Home Valuation Report is an in-depth analysis detailing your home's value as well as a comparison with similar homes in the area
Home Values in the Area
Average Home Value in this Area
Purchase History
| Date | Buyer | Sale Price | Title Company |
|---|---|---|---|
| Folan David K | $348,000 | -- |
Source: Public Records
Mortgage History
| Date | Status | Borrower | Loan Amount |
|---|---|---|---|
| Open | Folan David K | $278,400 | |
| Previous Owner | Folan David K | $200,000 |
Source: Public Records
Tax History Compared to Growth
Tax History
| Year | Tax Paid | Tax Assessment Tax Assessment Total Assessment is a certain percentage of the fair market value that is determined by local assessors to be the total taxable value of land and additions on the property. | Land | Improvement |
|---|---|---|---|---|
| 2025 | $5,369 | $531,600 | $248,900 | $282,700 |
| 2024 | $5,135 | $500,000 | $237,000 | $263,000 |
| 2023 | $4,840 | $463,200 | $219,500 | $243,700 |
| 2022 | $4,547 | $396,800 | $186,300 | $210,500 |
| 2021 | $4,324 | $368,300 | $186,300 | $182,000 |
| 2020 | $4,146 | $347,800 | $186,300 | $161,500 |
| 2019 | $4,046 | $333,800 | $179,100 | $154,700 |
| 2018 | $3,958 | $316,600 | $170,600 | $146,000 |
| 2017 | $3,896 | $304,100 | $162,500 | $141,600 |
| 2016 | $3,773 | $294,800 | $156,200 | $138,600 |
| 2015 | $3,607 | $279,600 | $149,100 | $130,500 |
| 2014 | $3,393 | $255,100 | $138,800 | $116,300 |
Source: Public Records
Map
Nearby Homes
- 116 Belmont St
- 501 Commerce Dr Unit 2310
- 501 Commerce Dr Unit 1111
- 501 Commerce Dr Unit 4206
- 501 Commerce Dr Unit 4308
- 501 Commerce Dr Unit 4306
- 200 Justin Dr Unit 3
- 655 Summer St
- 255 West St
- 262 West St
- 48 Apple Tree Ln
- 92 Mercury St
- 54 Federal St
- 432 Grove St
- 24 Blake Rd
- 441 Grove St
- 67 Abby Rd
- 972 Liberty St
- 2 Tara Dr Unit 1
- 33 Congress St