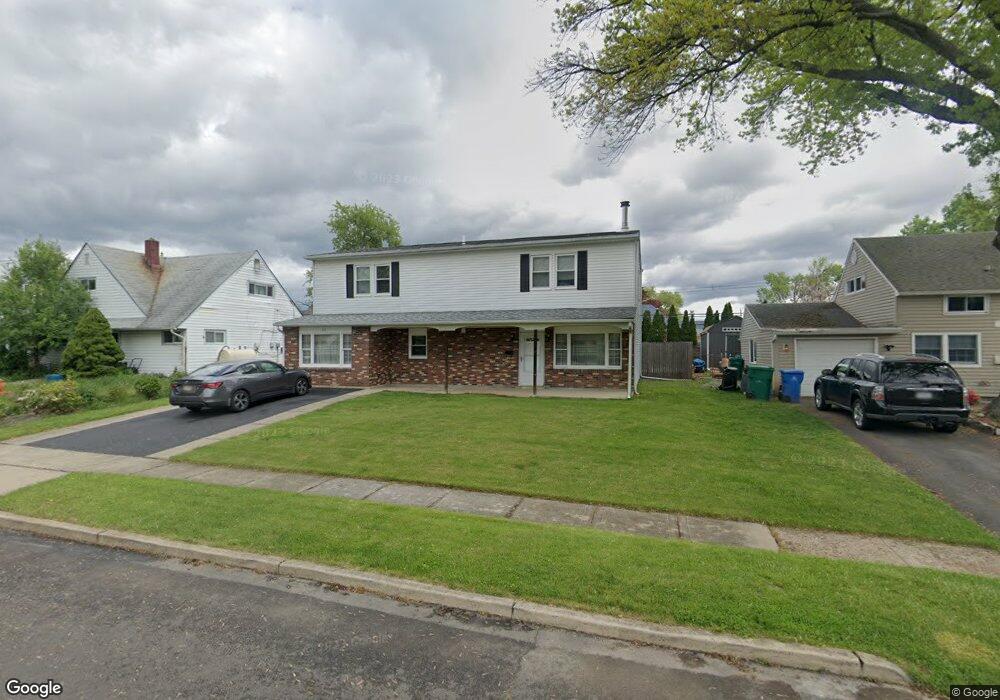
12 Alder Ln Levittown, PA 19055
Appletree Hill NeighborhoodEstimated Value: $378,000 - $470,000
Studio
2
Baths
2,454
Sq Ft
$174/Sq Ft
Est. Value
About This Home
This home is located at 12 Alder Ln, Levittown, PA 19055 and is currently estimated at $427,843, approximately $174 per square foot. 12 Alder Ln is a home located in Bucks County with nearby schools including Truman Senior High School, Emilie Christian Day School, and Hope Lutheran School.
Ownership History
Date
Name
Owned For
Owner Type
Purchase Details
Closed on
Jan 19, 2009
Sold by
Reilly Andrew J
Bought by
Reilly Andrew J
Current Estimated Value
Purchase Details
Closed on
Jun 19, 2008
Sold by
Reilly Andrew J
Bought by
Reilly Andrew J
Home Financials for this Owner
Home Financials are based on the most recent Mortgage that was taken out on this home.
Original Mortgage
$192,239
Outstanding Balance
$126,596
Interest Rate
6.57%
Mortgage Type
FHA
Estimated Equity
$301,247
Purchase Details
Closed on
Apr 17, 2007
Sold by
Reilly Andrew J
Bought by
Reilly Andrew J
Purchase Details
Closed on
Jun 22, 1998
Sold by
Drejerwski Joseph John and Drejerwski Jean C
Bought by
Reilly Andrew J
Home Financials for this Owner
Home Financials are based on the most recent Mortgage that was taken out on this home.
Original Mortgage
$104,400
Interest Rate
7.02%
Create a Home Valuation Report for This Property
The Home Valuation Report is an in-depth analysis detailing your home's value as well as a comparison with similar homes in the area
Home Values in the Area
Average Home Value in this Area
Purchase History
| Date | Buyer | Sale Price | Title Company |
|---|---|---|---|
| Reilly Andrew J | -- | None Available | |
| Reilly Andrew J | -- | Transcontinental Title Co | |
| Reilly Andrew J | -- | None Available | |
| Reilly Andrew J | $109,900 | Lawyers Title Insurance Corp |
Source: Public Records
Mortgage History
| Date | Status | Borrower | Loan Amount |
|---|---|---|---|
| Open | Reilly Andrew J | $192,239 | |
| Closed | Reilly Andrew J | $104,400 |
Source: Public Records
Tax History
| Year | Tax Paid | Tax Assessment Tax Assessment Total Assessment is a certain percentage of the fair market value that is determined by local assessors to be the total taxable value of land and additions on the property. | Land | Improvement |
|---|---|---|---|---|
| 2025 | $5,736 | $20,300 | $3,960 | $16,340 |
| 2024 | $5,736 | $21,120 | $3,960 | $17,160 |
| 2023 | $5,693 | $21,120 | $3,960 | $17,160 |
| 2022 | $5,693 | $21,120 | $3,960 | $17,160 |
| 2021 | $5,693 | $21,120 | $3,960 | $17,160 |
| 2020 | $5,693 | $21,120 | $3,960 | $17,160 |
| 2019 | $5,672 | $21,120 | $3,960 | $17,160 |
| 2018 | $5,581 | $21,120 | $3,960 | $17,160 |
| 2017 | $5,496 | $21,120 | $3,960 | $17,160 |
| 2016 | $5,496 | $21,120 | $3,960 | $17,160 |
| 2015 | $3,988 | $21,120 | $3,960 | $17,160 |
| 2014 | $3,988 | $21,120 | $3,960 | $17,160 |
Source: Public Records
Map
Nearby Homes
- 27 Almond Ln
- 334 Crabtree Dr
- 50 Red Cedar Dr
- 6 Chestnut Ln
- L:108 Cypress Ave
- 42 Hollyhock Ln
- 59 Graystone Ln
- L235.17 Edgely Rd
- 165 Crabtree Dr
- 302 Oaktree Dr
- 423 Magnolia Dr
- 5 Glenwood Ln
- 19 Walnut Ln
- 10 Ivy Ln
- 90 Cedar Cir Unit 66
- 48 Gridiron Rd
- 12 Ivy Ln
- 30 Mistletoe Ln
- 14 Iris Rd
- 8 Ivy Ln Unit 94
Your Personal Tour Guide
Ask me questions while you tour the home.