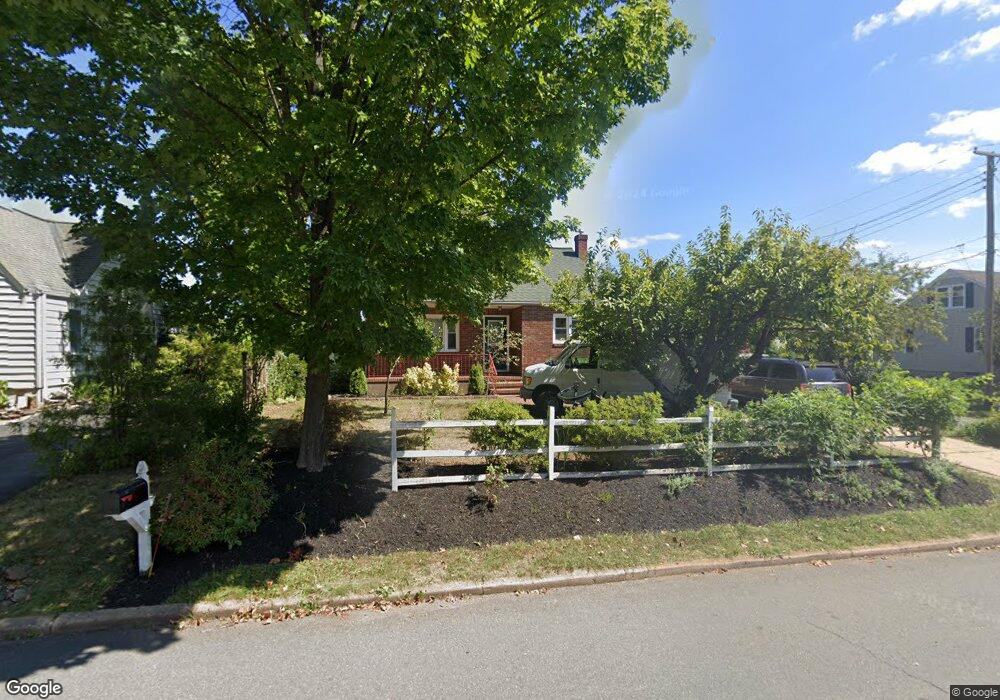
12 Allen St Flemington, NJ 08822
Estimated Value: $360,000 - $451,000
Studio
--
Bath
1,442
Sq Ft
$278/Sq Ft
Est. Value
About This Home
This home is located at 12 Allen St, Flemington, NJ 08822 and is currently estimated at $401,547, approximately $278 per square foot. 12 Allen St is a home located in Hunterdon County with nearby schools including Robert Hunter Elementary School, Reading Fleming Intermediate School, and J.P. Case Middle School.
Ownership History
Date
Name
Owned For
Owner Type
Purchase Details
Closed on
Oct 29, 2001
Sold by
Estate Of Joseph P Meister
Bought by
Santiago Jeronimo and Santiago Patricia
Current Estimated Value
Home Financials for this Owner
Home Financials are based on the most recent Mortgage that was taken out on this home.
Original Mortgage
$159,350
Outstanding Balance
$62,924
Interest Rate
6.86%
Mortgage Type
FHA
Estimated Equity
$338,623
Purchase Details
Closed on
Jun 16, 1989
Sold by
Shaikh Ibrehim and Shaikh N
Bought by
Mmeister Joseph P and Mmeister Suzanne M
Create a Home Valuation Report for This Property
The Home Valuation Report is an in-depth analysis detailing your home's value as well as a comparison with similar homes in the area
Home Values in the Area
Average Home Value in this Area
Purchase History
| Date | Buyer | Sale Price | Title Company |
|---|---|---|---|
| Santiago Jeronimo | $165,000 | -- | |
| Mmeister Joseph P | $120,000 | -- |
Source: Public Records
Mortgage History
| Date | Status | Borrower | Loan Amount |
|---|---|---|---|
| Open | Santiago Jeronimo | $159,350 |
Source: Public Records
Tax History
| Year | Tax Paid | Tax Assessment Tax Assessment Total Assessment is a certain percentage of the fair market value that is determined by local assessors to be the total taxable value of land and additions on the property. | Land | Improvement |
|---|---|---|---|---|
| 2025 | $7,927 | $303,100 | $121,500 | $181,600 |
| 2024 | $7,705 | $281,500 | $111,400 | $170,100 |
Source: Public Records
Map
Nearby Homes
Your Personal Tour Guide
Ask me questions while you tour the home.