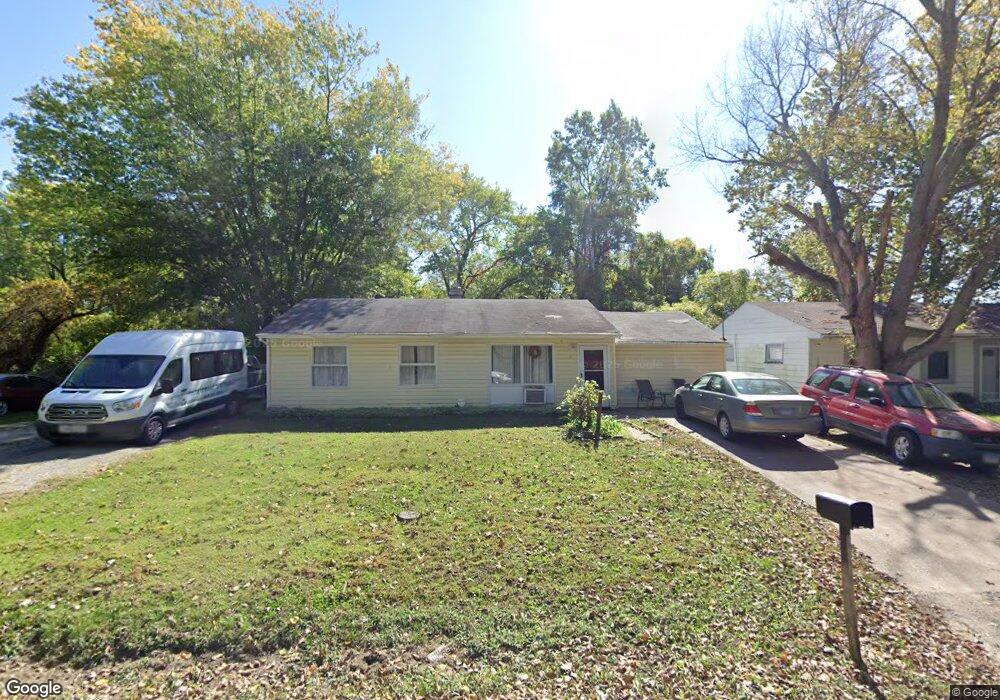
12 Amelia Dr East Saint Louis, IL 62206
Estimated Value: $37,000 - $54,000
--
Bed
--
Bath
925
Sq Ft
$48/Sq Ft
Est. Value
About This Home
This home is located at 12 Amelia Dr, East Saint Louis, IL 62206 and is currently estimated at $44,854, approximately $48 per square foot. 12 Amelia Dr is a home located in St. Clair County.
Ownership History
Date
Name
Owned For
Owner Type
Purchase Details
Closed on
Jul 21, 2016
Sold by
Saint Clair County
Bought by
Moran Carliss A and Moran Lois A
Current Estimated Value
Purchase Details
Closed on
Nov 8, 2010
Sold by
County Of Saint Clair
Bought by
Moran Lois
Purchase Details
Closed on
Jul 27, 2010
Sold by
Cooper Gene
Bought by
County Of Saint Clair
Purchase Details
Closed on
Aug 15, 2009
Sold by
Cooper Gene
Bought by
Moran Lois
Purchase Details
Closed on
Oct 9, 2003
Sold by
Manufacturers & Traders Trust Co
Bought by
Cooper Gene
Purchase Details
Closed on
Feb 12, 2003
Sold by
Coleman Herbert
Bought by
Manufacturers & Traders Trust Co
Create a Home Valuation Report for This Property
The Home Valuation Report is an in-depth analysis detailing your home's value as well as a comparison with similar homes in the area
Home Values in the Area
Average Home Value in this Area
Purchase History
| Date | Buyer | Sale Price | Title Company |
|---|---|---|---|
| Moran Carliss A | -- | None Available | |
| Moran Lois | -- | None Available | |
| County Of Saint Clair | -- | None Available | |
| Moran Lois | -- | None Available | |
| Cooper Gene | $6,500 | First American Title Insuran | |
| Manufacturers & Traders Trust Co | -- | -- |
Source: Public Records
Tax History Compared to Growth
Tax History
| Year | Tax Paid | Tax Assessment Tax Assessment Total Assessment is a certain percentage of the fair market value that is determined by local assessors to be the total taxable value of land and additions on the property. | Land | Improvement |
|---|---|---|---|---|
| 2024 | -- | $6,511 | $462 | $6,049 |
| 2023 | -- | $5,885 | $418 | $5,467 |
| 2022 | $0 | $5,157 | $366 | $4,791 |
| 2021 | $0 | $4,887 | $347 | $4,540 |
| 2020 | $0 | $4,434 | $364 | $4,070 |
| 2019 | $0 | $4,434 | $364 | $4,070 |
| 2018 | $0 | $4,498 | $369 | $4,129 |
| 2017 | $0 | $4,389 | $360 | $4,029 |
| 2016 | $0 | $5,330 | $359 | $4,971 |
| 2014 | $1,948 | $5,272 | $355 | $4,917 |
| 2013 | $1,948 | $4,945 | $333 | $4,612 |
Source: Public Records
Map
Nearby Homes