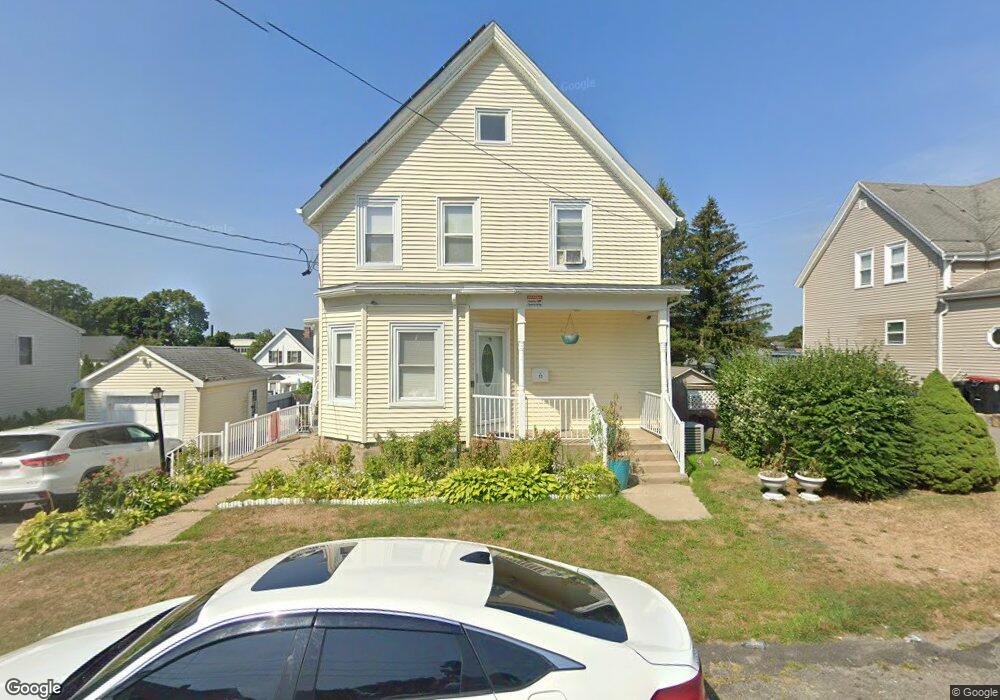
12 Andover St Brockton, MA 02302
Montello NeighborhoodEstimated Value: $532,779 - $575,000
4
Beds
2
Baths
1,809
Sq Ft
$303/Sq Ft
Est. Value
About This Home
This home is located at 12 Andover St, Brockton, MA 02302 and is currently estimated at $548,695, approximately $303 per square foot. 12 Andover St is a home located in Plymouth County with nearby schools including Brookfield Elementary School, Mary E. Baker Elementary School, and Downey Elementary School.
Ownership History
Date
Name
Owned For
Owner Type
Purchase Details
Closed on
May 25, 2017
Sold by
Semeter Karla E
Bought by
Vieira Armanda F
Current Estimated Value
Home Financials for this Owner
Home Financials are based on the most recent Mortgage that was taken out on this home.
Original Mortgage
$265,475
Outstanding Balance
$222,567
Interest Rate
4.4%
Mortgage Type
FHA
Estimated Equity
$326,128
Create a Home Valuation Report for This Property
The Home Valuation Report is an in-depth analysis detailing your home's value as well as a comparison with similar homes in the area
Home Values in the Area
Average Home Value in this Area
Purchase History
| Date | Buyer | Sale Price | Title Company |
|---|---|---|---|
| Vieira Armanda F | $289,900 | -- |
Source: Public Records
Mortgage History
| Date | Status | Borrower | Loan Amount |
|---|---|---|---|
| Open | Vieira Armanda F | $265,475 |
Source: Public Records
Tax History Compared to Growth
Tax History
| Year | Tax Paid | Tax Assessment Tax Assessment Total Assessment is a certain percentage of the fair market value that is determined by local assessors to be the total taxable value of land and additions on the property. | Land | Improvement |
|---|---|---|---|---|
| 2025 | $5,522 | $456,000 | $140,100 | $315,900 |
| 2024 | $5,463 | $454,500 | $140,100 | $314,400 |
| 2023 | $5,173 | $398,500 | $104,600 | $293,900 |
| 2022 | $4,838 | $346,300 | $95,100 | $251,200 |
| 2021 | $4,486 | $309,400 | $79,100 | $230,300 |
| 2020 | $4,194 | $276,800 | $74,000 | $202,800 |
| 2019 | $4,096 | $263,600 | $72,200 | $191,400 |
| 2018 | $3,964 | $246,800 | $72,200 | $174,600 |
| 2017 | $3,771 | $234,200 | $72,200 | $162,000 |
| 2016 | $3,309 | $190,600 | $70,000 | $120,600 |
| 2015 | $2,882 | $158,800 | $70,000 | $88,800 |
| 2014 | $2,977 | $164,200 | $70,000 | $94,200 |
Source: Public Records
Map
Nearby Homes
- 12 Andover St Unit 12
- 16 Andover St
- 2 Andover St
- 3 Burton St
- 39 Glendale St
- 11 Burton St
- 37 Glendale St
- 7 Andover St
- 17 Burton St
- 19 Burton St Unit 1
- 3 Andover St
- 9 Burton St
- 9 Burton St Unit 3
- 9 Burton St Unit 2
- 9 Burton St Unit 1
- 9 Burton St Unit 1
- 11 Andover St
- 1-1 Andover St Plot 1-1
- 51 Glendale St
- 51 Glendale St Unit 1A