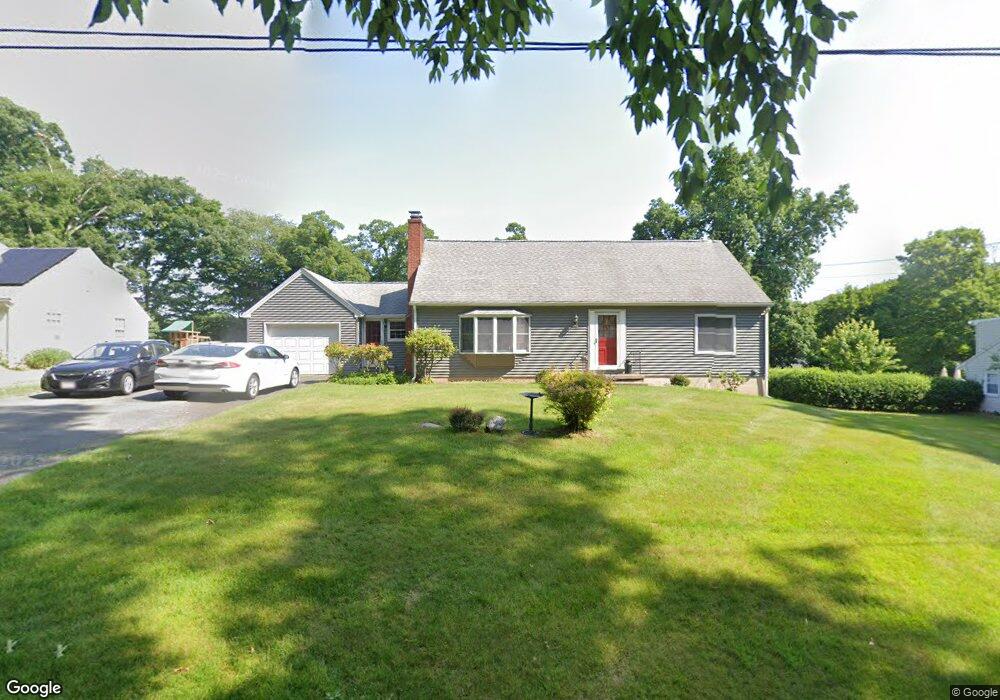
12 Arbor Ln Wilbraham, MA 01095
Estimated Value: $500,966 - $556,000
4
Beds
3
Baths
2,134
Sq Ft
$246/Sq Ft
Est. Value
About This Home
This home is located at 12 Arbor Ln, Wilbraham, MA 01095 and is currently estimated at $525,742, approximately $246 per square foot. 12 Arbor Ln is a home located in Hampden County with nearby schools including Minnechaug Regional High School and Wilbraham & Monson Academy.
Ownership History
Date
Name
Owned For
Owner Type
Purchase Details
Closed on
Oct 15, 2004
Sold by
Hebert Carol Delisio and Hebert Michael D
Bought by
Rasid Ginger and Rasid Johan
Current Estimated Value
Home Financials for this Owner
Home Financials are based on the most recent Mortgage that was taken out on this home.
Original Mortgage
$236,000
Interest Rate
5.8%
Mortgage Type
Purchase Money Mortgage
Purchase Details
Closed on
Mar 15, 1999
Sold by
Fournier Joanne
Bought by
Hebert Michael D and Hebert Carol D
Purchase Details
Closed on
Feb 10, 1989
Sold by
Deforest Russell P
Bought by
Fournier Richrad L
Create a Home Valuation Report for This Property
The Home Valuation Report is an in-depth analysis detailing your home's value as well as a comparison with similar homes in the area
Home Values in the Area
Average Home Value in this Area
Purchase History
| Date | Buyer | Sale Price | Title Company |
|---|---|---|---|
| Rasid Ginger | $295,000 | -- | |
| Hebert Michael D | $184,700 | -- | |
| Fournier Richrad L | $172,250 | -- |
Source: Public Records
Mortgage History
| Date | Status | Borrower | Loan Amount |
|---|---|---|---|
| Open | Fournier Richrad L | $251,700 | |
| Closed | Rasid Ginger | $236,000 | |
| Closed | Rasid Ginger | $44,250 | |
| Previous Owner | Fournier Richrad L | $40,000 |
Source: Public Records
Tax History
| Year | Tax Paid | Tax Assessment Tax Assessment Total Assessment is a certain percentage of the fair market value that is determined by local assessors to be the total taxable value of land and additions on the property. | Land | Improvement |
|---|---|---|---|---|
| 2025 | $7,048 | $394,200 | $96,600 | $297,600 |
| 2024 | $6,379 | $344,800 | $96,600 | $248,200 |
| 2023 | $6,178 | $322,800 | $96,600 | $226,200 |
| 2022 | $6,178 | $301,500 | $96,600 | $204,900 |
| 2021 | $5,926 | $258,100 | $103,700 | $154,400 |
| 2020 | $5,776 | $258,100 | $103,700 | $154,400 |
| 2019 | $5,629 | $258,200 | $103,700 | $154,500 |
| 2018 | $5,452 | $240,800 | $103,700 | $137,100 |
| 2017 | $5,298 | $240,800 | $103,700 | $137,100 |
| 2016 | $5,141 | $238,000 | $115,300 | $122,700 |
| 2015 | $4,969 | $238,000 | $115,300 | $122,700 |
Source: Public Records
Map
Nearby Homes
- 20 Old Orchard Rd
- 474 Mountain Rd
- 6 Hilltop Park
- 8 Patriot Ridge Ln
- 474-480 Mountain Rd
- 172 Main St
- 8 High Pine Cir
- 104 High Pine Cir
- 1 Aspen Dr
- 35 Lake Dr
- 4 Hillcrest Dr
- 46 Washington Rd
- 745 Glendale Rd
- 16 Maple St
- 36 Maple St
- 592 Stony Hill Rd
- 6 Teak Terrace Unit 24
- 103 Sandalwood Dr Unit site 00
- 57 Sandalwood Dr Unit site 61
- 84 Sandalwood Dr Unit site 00
Your Personal Tour Guide
Ask me questions while you tour the home.