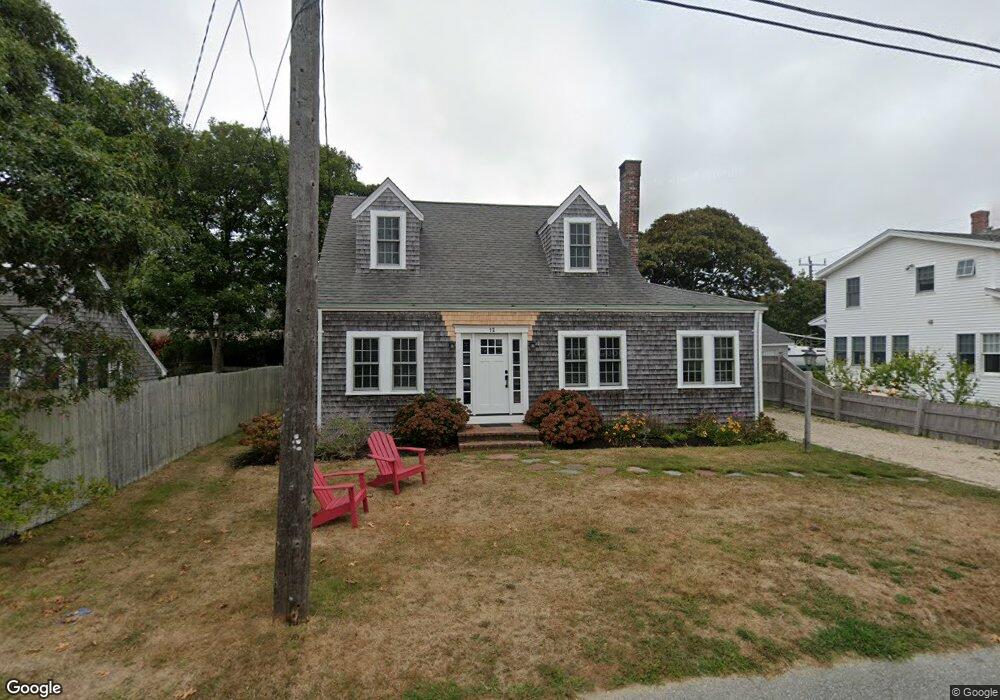
12 Ardmore St Teaticket, MA 02536
Teaticket NeighborhoodEstimated Value: $889,000 - $974,329
4
Beds
2
Baths
1,336
Sq Ft
$699/Sq Ft
Est. Value
About This Home
This home is located at 12 Ardmore St, Teaticket, MA 02536 and is currently estimated at $934,332, approximately $699 per square foot. 12 Ardmore St is a home located in Barnstable County with nearby schools including Teaticket Elementary School, Morse Pond School, and Lawrence School.
Ownership History
Date
Name
Owned For
Owner Type
Purchase Details
Closed on
Jul 20, 2009
Sold by
Dmp T T and Dmp Kelly
Bought by
Horst Arthur and Horst Martha
Current Estimated Value
Home Financials for this Owner
Home Financials are based on the most recent Mortgage that was taken out on this home.
Original Mortgage
$311,200
Outstanding Balance
$203,109
Interest Rate
5.31%
Mortgage Type
Purchase Money Mortgage
Estimated Equity
$731,223
Create a Home Valuation Report for This Property
The Home Valuation Report is an in-depth analysis detailing your home's value as well as a comparison with similar homes in the area
Home Values in the Area
Average Home Value in this Area
Purchase History
| Date | Buyer | Sale Price | Title Company |
|---|---|---|---|
| Horst Arthur | $389,000 | -- |
Source: Public Records
Mortgage History
| Date | Status | Borrower | Loan Amount |
|---|---|---|---|
| Open | Horst Arthur | $311,200 |
Source: Public Records
Tax History
| Year | Tax Paid | Tax Assessment Tax Assessment Total Assessment is a certain percentage of the fair market value that is determined by local assessors to be the total taxable value of land and additions on the property. | Land | Improvement |
|---|---|---|---|---|
| 2025 | $4,399 | $749,400 | $430,000 | $319,400 |
| 2024 | $3,774 | $601,000 | $373,300 | $227,700 |
| 2023 | $3,510 | $507,200 | $311,100 | $196,100 |
| 2022 | $3,401 | $422,500 | $265,200 | $157,300 |
| 2021 | $3,421 | $402,500 | $265,200 | $137,300 |
| 2020 | $3,250 | $378,400 | $241,100 | $137,300 |
| 2019 | $3,209 | $374,900 | $241,100 | $133,800 |
| 2018 | $3,190 | $370,900 | $241,100 | $129,800 |
| 2017 | $3,130 | $366,900 | $241,100 | $125,800 |
| 2016 | $3,071 | $366,900 | $241,100 | $125,800 |
| 2015 | $3,005 | $366,900 | $241,100 | $125,800 |
| 2014 | $2,989 | $366,700 | $241,200 | $125,500 |
Source: Public Records
Map
Nearby Homes
- 61 Menauhant Rd
- 24 Montgomery Ct
- 56 Raymond St
- Lot 2 Pine Grove Ave
- 15 Beach St
- 108 Lucerne Ave
- 65 Cypress St
- 136 Sanddollar Cir
- 253 Scranton Ave
- 480 Main St Unit 13
- 480 Main St Unit 1
- 156 Teaticket Hwy
- 531 Menauhant Rd
- 16 Edgewood Dr
- 528 Menauhant Rd
- 276 Shore St
- 7 Dexter Mill Dr
- 90 E Harbor Dr
- 44 Elvira Ave
- 116 Seabrook Dr
Your Personal Tour Guide
Ask me questions while you tour the home.