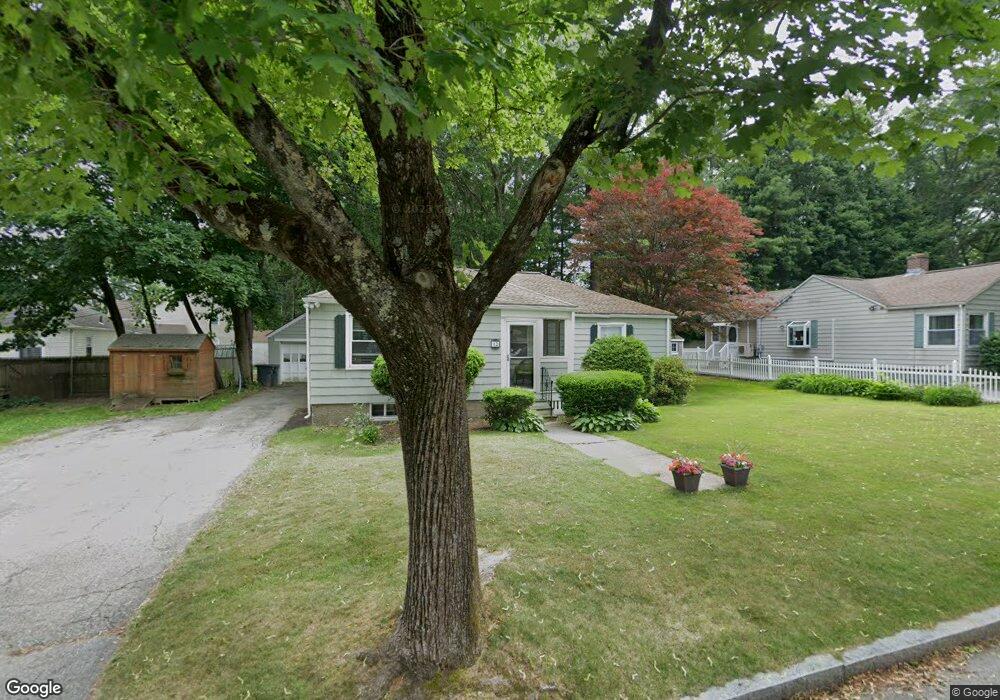
12 Asbury Rd Worcester, MA 01602
Newton Square NeighborhoodEstimated Value: $407,000 - $431,578
3
Beds
2
Baths
1,120
Sq Ft
$376/Sq Ft
Est. Value
About This Home
This home is located at 12 Asbury Rd, Worcester, MA 01602 and is currently estimated at $420,895, approximately $375 per square foot. 12 Asbury Rd is a home located in Worcester County with nearby schools including Chandler Magnet, Jacob Hiatt Magnet School, and May Street Elementary School.
Ownership History
Date
Name
Owned For
Owner Type
Purchase Details
Closed on
Jul 7, 2011
Sold by
Price Diane
Bought by
Wrixon Joseph B
Current Estimated Value
Home Financials for this Owner
Home Financials are based on the most recent Mortgage that was taken out on this home.
Original Mortgage
$161,791
Outstanding Balance
$112,560
Interest Rate
4.75%
Mortgage Type
FHA
Estimated Equity
$308,335
Create a Home Valuation Report for This Property
The Home Valuation Report is an in-depth analysis detailing your home's value as well as a comparison with similar homes in the area
Home Values in the Area
Average Home Value in this Area
Purchase History
| Date | Buyer | Sale Price | Title Company |
|---|---|---|---|
| Wrixon Joseph B | $166,000 | -- |
Source: Public Records
Mortgage History
| Date | Status | Borrower | Loan Amount |
|---|---|---|---|
| Open | Wrixon Joseph B | $161,791 |
Source: Public Records
Tax History Compared to Growth
Tax History
| Year | Tax Paid | Tax Assessment Tax Assessment Total Assessment is a certain percentage of the fair market value that is determined by local assessors to be the total taxable value of land and additions on the property. | Land | Improvement |
|---|---|---|---|---|
| 2025 | $4,688 | $355,400 | $118,700 | $236,700 |
| 2024 | $4,591 | $333,900 | $118,700 | $215,200 |
| 2023 | $4,434 | $309,200 | $103,200 | $206,000 |
| 2022 | $3,933 | $258,600 | $82,600 | $176,000 |
| 2021 | $3,847 | $236,300 | $66,100 | $170,200 |
| 2020 | $3,859 | $227,000 | $66,100 | $160,900 |
| 2019 | $3,634 | $201,900 | $59,500 | $142,400 |
| 2018 | $3,530 | $186,700 | $59,500 | $127,200 |
| 2017 | $3,588 | $186,700 | $59,500 | $127,200 |
| 2016 | $3,506 | $170,100 | $43,700 | $126,400 |
| 2015 | $3,414 | $170,100 | $43,700 | $126,400 |
| 2014 | $3,107 | $159,000 | $43,700 | $115,300 |
Source: Public Records
Map
Nearby Homes
- 16 Sherwood Rd
- 19 Kenilworth Rd
- 9 Field Way
- 980 Pleasant St
- 20 Manhattan Rd
- 563 Chandler St
- 57 Berwick St
- 31 Lenox St
- 24 Hadwen Rd
- 250 May St
- 40 Howland Terrace
- 53 Howland Terrace
- 40 Rustic Dr
- 1029 Pleasant St Unit 19
- 34 Monroe Ave
- 47R Yarnie Unit 3B
- 47R Yarnie Unit 3A
- 47R Yarnie Unit 1B
- 47R Yarnie Unit 2B
- 47R Yarnie Unit 4B