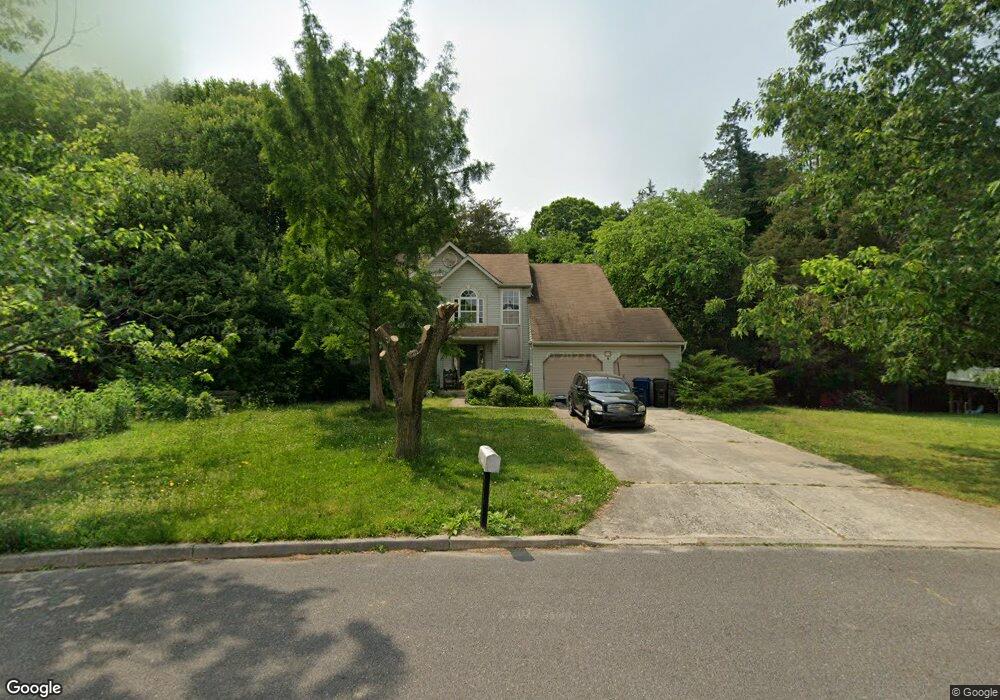
12 Banff Dr Mullica Hill, NJ 08062
Estimated Value: $550,000 - $639,000
--
Bed
--
Bath
2,386
Sq Ft
$246/Sq Ft
Est. Value
About This Home
This home is located at 12 Banff Dr, Mullica Hill, NJ 08062 and is currently estimated at $585,842, approximately $245 per square foot. 12 Banff Dr is a home located in Gloucester County with nearby schools including Harrison Township Elementary School, Pleasant Valley School, and Clearview Regional Middle School.
Ownership History
Date
Name
Owned For
Owner Type
Purchase Details
Closed on
Aug 15, 2006
Sold by
Cartus Financail Corp
Bought by
Angela Groff
Current Estimated Value
Home Financials for this Owner
Home Financials are based on the most recent Mortgage that was taken out on this home.
Original Mortgage
$312,000
Outstanding Balance
$186,811
Interest Rate
6.71%
Estimated Equity
$399,031
Purchase Details
Closed on
Jun 23, 2006
Sold by
Greg Laegen
Bought by
Catrus Financial Corp
Home Financials for this Owner
Home Financials are based on the most recent Mortgage that was taken out on this home.
Original Mortgage
$312,000
Outstanding Balance
$186,811
Interest Rate
6.71%
Estimated Equity
$399,031
Purchase Details
Closed on
Sep 28, 1994
Sold by
Mullica Chase Associates
Bought by
Laegen Greg and Laegen Brooke B
Create a Home Valuation Report for This Property
The Home Valuation Report is an in-depth analysis detailing your home's value as well as a comparison with similar homes in the area
Home Values in the Area
Average Home Value in this Area
Purchase History
| Date | Buyer | Sale Price | Title Company |
|---|---|---|---|
| Angela Groff | $390,000 | -- | |
| Catrus Financial Corp | $390,000 | -- | |
| Laegen Greg | $172,085 | Citizens Title Ins Agency In |
Source: Public Records
Mortgage History
| Date | Status | Borrower | Loan Amount |
|---|---|---|---|
| Open | Angela Groff | $312,000 | |
| Previous Owner | Catrus Financial Corp | $312,000 |
Source: Public Records
Tax History Compared to Growth
Tax History
| Year | Tax Paid | Tax Assessment Tax Assessment Total Assessment is a certain percentage of the fair market value that is determined by local assessors to be the total taxable value of land and additions on the property. | Land | Improvement |
|---|---|---|---|---|
| 2025 | $9,887 | $295,300 | $57,900 | $237,400 |
| 2024 | $9,556 | $295,300 | $57,900 | $237,400 |
| 2023 | $9,556 | $295,300 | $57,900 | $237,400 |
| 2022 | $9,461 | $295,300 | $57,900 | $237,400 |
| 2021 | $9,243 | $295,300 | $57,900 | $237,400 |
| 2020 | $9,066 | $295,300 | $57,900 | $237,400 |
| 2019 | $8,794 | $295,300 | $57,900 | $237,400 |
| 2018 | $8,552 | $295,300 | $57,900 | $237,400 |
| 2017 | $8,342 | $295,300 | $57,900 | $237,400 |
| 2016 | $8,919 | $298,300 | $58,100 | $240,200 |
| 2015 | $8,666 | $298,300 | $58,100 | $240,200 |
| 2014 | $8,314 | $298,300 | $58,100 | $240,200 |
Source: Public Records
Map
Nearby Homes