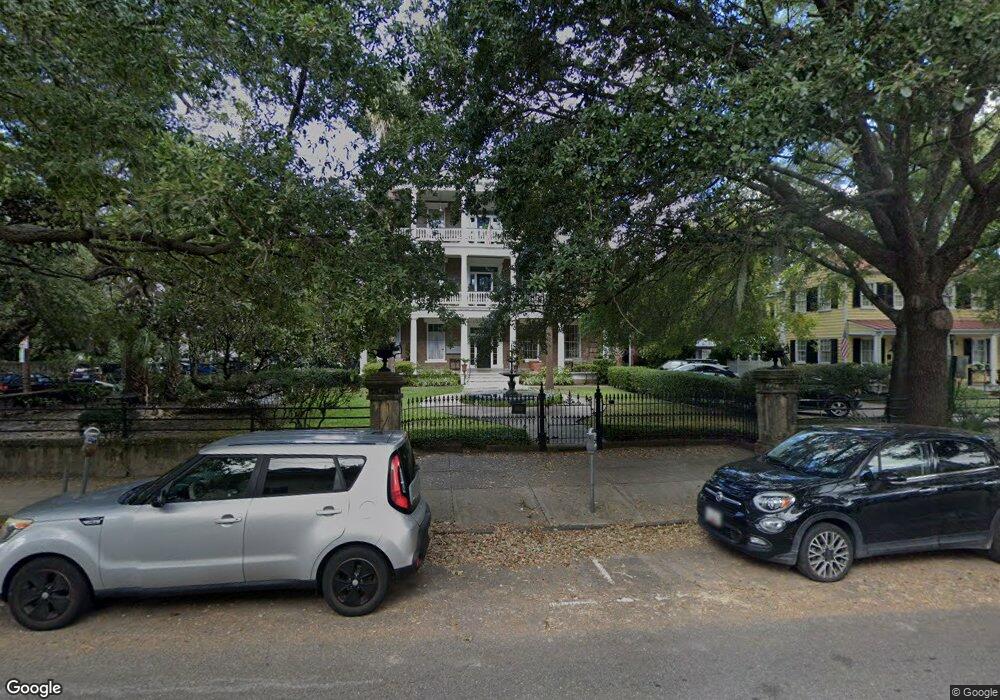
12 Bee St Unit 202F Charleston, SC 29403
Cannonborough-Elliotborough NeighborhoodEstimated Value: $428,000 - $526,143
2
Beds
1
Bath
637
Sq Ft
$751/Sq Ft
Est. Value
About This Home
This home is located at 12 Bee St Unit 202F, Charleston, SC 29403 and is currently estimated at $478,536, approximately $751 per square foot. 12 Bee St Unit 202F is a home located in Charleston County with nearby schools including Memminger Elementary School, Simmons Pinckney Middle, and Burke High School.
Ownership History
Date
Name
Owned For
Owner Type
Purchase Details
Closed on
Jun 20, 2024
Sold by
Costello Christopher and Costello Kathleen
Bought by
Elshami Nadeam A and Elshami Stacy C
Current Estimated Value
Home Financials for this Owner
Home Financials are based on the most recent Mortgage that was taken out on this home.
Original Mortgage
$357,200
Outstanding Balance
$352,642
Interest Rate
7.02%
Mortgage Type
New Conventional
Estimated Equity
$125,894
Purchase Details
Closed on
May 2, 2022
Sold by
Sieckman Leonard C and Sieckman Judith L
Bought by
Costello Christopher and Costello Kathleen
Purchase Details
Closed on
Jun 30, 2019
Sold by
Sieckman Bradley Graham
Bought by
Sieckman Leonard C and Sieckman Judith L
Purchase Details
Closed on
Mar 3, 2015
Sold by
Sieckman Bradley Graham
Bought by
Sieckman Leonard C and Sieckman Judith L
Purchase Details
Closed on
Jan 31, 2013
Sold by
Carrell Properties Llc
Bought by
Sieckman Bradley Graham
Create a Home Valuation Report for This Property
The Home Valuation Report is an in-depth analysis detailing your home's value as well as a comparison with similar homes in the area
Home Values in the Area
Average Home Value in this Area
Purchase History
| Date | Buyer | Sale Price | Title Company |
|---|---|---|---|
| Elshami Nadeam A | $446,500 | None Listed On Document | |
| Costello Christopher | $337,500 | Mccants Law Firm | |
| Sieckman Leonard C | -- | None Available | |
| Sieckman Leonard C | -- | -- | |
| Sieckman Bradley Graham | $140,000 | -- |
Source: Public Records
Mortgage History
| Date | Status | Borrower | Loan Amount |
|---|---|---|---|
| Open | Elshami Nadeam A | $357,200 |
Source: Public Records
Tax History Compared to Growth
Tax History
| Year | Tax Paid | Tax Assessment Tax Assessment Total Assessment is a certain percentage of the fair market value that is determined by local assessors to be the total taxable value of land and additions on the property. | Land | Improvement |
|---|---|---|---|---|
| 2024 | $1,470 | $10,700 | $0 | $0 |
| 2023 | $1,470 | $10,700 | $0 | $0 |
| 2022 | $797 | $5,960 | $0 | $0 |
| 2021 | $2,427 | $8,930 | $0 | $0 |
| 2020 | $3,821 | $8,930 | $0 | $0 |
| 2019 | $2,209 | $7,770 | $0 | $0 |
| 2017 | $2,114 | $7,770 | $0 | $0 |
| 2016 | $2,047 | $7,770 | $0 | $0 |
| 2015 | $742 | $5,180 | $0 | $0 |
| 2014 | $2,574 | $0 | $0 | $0 |
| 2011 | -- | $0 | $0 | $0 |
Source: Public Records
Map
Nearby Homes
- 12 Bee St Unit C
- 192 Ashley Ave Unit C
- 184 Ashley Ave
- 188 Rutledge Ave
- 194 Rutledge Ave
- 94 Morris St Unit A, B, C, D
- 5 Oliver Ct
- 221 Ashley Ave Unit Abc
- 40 Bee St Unit 309
- 40 Bee St Unit 112
- 40 Bee St Unit 111
- 87 Cannon St
- 7 Doughty St Unit F
- 151 Spring St Unit A
- 134 Spring St
- 3.5 Kracke St Unit C
- 169 Spring St Unit Abc
- 171 Spring St Unit Abc
- 170 Spring St
- 5 President Place
- 12 Bee St Unit F
- 12 Bee St Unit 202E
- 12 Bee St Unit 202D
- 12 Bee St Unit 202C
- 12 Bee St Unit 202B
- 12 Bee St Unit 202G
- 12 Bee St Unit 12C
- 12 Bee St Unit 12G
- 12 Bee St Unit 12F
- 12 Bee St Unit 12E
- 12 Bee St Unit 12D
- 12 Bee St Unit 12B
- 12 Bee St Unit 12A
- 12 Bee St Unit 19
- 12 Bee St Unit 18
- 12 Bee St
- 12 Bee St Unit E
- 12 Bee St Unit G
- 12 Bee St Unit B
- 12 Bee St Unit F