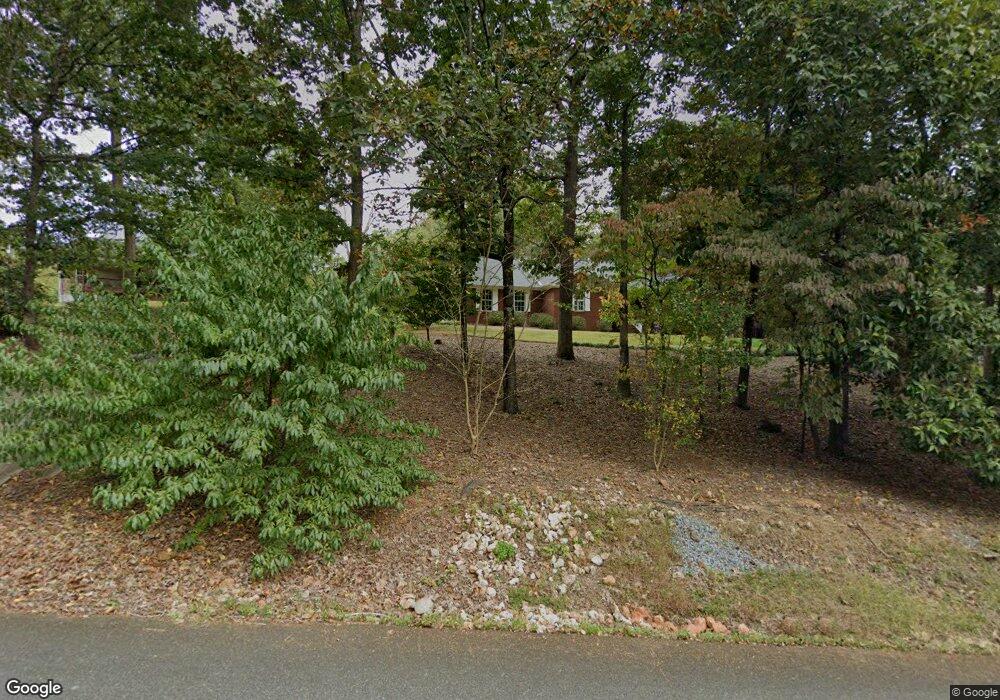
12 Bevil Ridge Rd SE Emerson, GA 30137
Estimated Value: $296,000 - $369,000
4
Beds
2
Baths
1,338
Sq Ft
$248/Sq Ft
Est. Value
About This Home
This home is located at 12 Bevil Ridge Rd SE, Emerson, GA 30137 and is currently estimated at $331,466, approximately $247 per square foot. 12 Bevil Ridge Rd SE is a home located in Bartow County with nearby schools including Emerson Elementary School, Red Top Middle School, and Woodland High School.
Ownership History
Date
Name
Owned For
Owner Type
Purchase Details
Closed on
Mar 6, 2015
Sold by
Mauthe Peggy
Bought by
Burnett Kristina N
Current Estimated Value
Home Financials for this Owner
Home Financials are based on the most recent Mortgage that was taken out on this home.
Original Mortgage
$115,371
Outstanding Balance
$88,395
Interest Rate
3.69%
Mortgage Type
FHA
Estimated Equity
$243,071
Purchase Details
Closed on
Sep 26, 2012
Sold by
Roberson Jeremy
Bought by
Mauthe Peggy
Purchase Details
Closed on
Sep 4, 2012
Sold by
Durham Amy H
Bought by
Roberson Jeremy
Purchase Details
Closed on
Mar 10, 2005
Sold by
Mauthe Peggy H
Bought by
Durham Amy H
Home Financials for this Owner
Home Financials are based on the most recent Mortgage that was taken out on this home.
Original Mortgage
$136,800
Interest Rate
5.54%
Mortgage Type
New Conventional
Create a Home Valuation Report for This Property
The Home Valuation Report is an in-depth analysis detailing your home's value as well as a comparison with similar homes in the area
Home Values in the Area
Average Home Value in this Area
Purchase History
| Date | Buyer | Sale Price | Title Company |
|---|---|---|---|
| Burnett Kristina N | $117,500 | -- | |
| Mauthe Peggy | $79,000 | -- | |
| Roberson Jeremy | -- | -- | |
| Durham Amy H | $136,800 | -- |
Source: Public Records
Mortgage History
| Date | Status | Borrower | Loan Amount |
|---|---|---|---|
| Open | Burnett Kristina N | $115,371 | |
| Previous Owner | Durham Amy H | $136,800 |
Source: Public Records
Tax History Compared to Growth
Tax History
| Year | Tax Paid | Tax Assessment Tax Assessment Total Assessment is a certain percentage of the fair market value that is determined by local assessors to be the total taxable value of land and additions on the property. | Land | Improvement |
|---|---|---|---|---|
| 2024 | $2,999 | $126,054 | $18,000 | $108,054 |
| 2023 | $2,907 | $121,320 | $18,000 | $103,320 |
| 2022 | $2,914 | $121,320 | $18,000 | $103,320 |
| 2021 | $1,939 | $79,301 | $18,000 | $61,301 |
| 2020 | $2,041 | $79,301 | $18,000 | $61,301 |
| 2019 | $1,718 | $66,886 | $12,000 | $54,886 |
| 2018 | $1,680 | $65,309 | $12,000 | $53,309 |
| 2017 | $1,479 | $57,805 | $3,390 | $54,415 |
| 2016 | $1,163 | $46,240 | $6,600 | $39,640 |
| 2015 | $1,230 | $43,520 | $6,600 | $36,920 |
| 2014 | $1,096 | $37,560 | $6,600 | $30,960 |
| 2013 | -- | $31,600 | $6,600 | $25,000 |
Source: Public Records
Map
Nearby Homes
- 131 Old Alabama Rd SE
- 127 Old Alabama Rd SE
- 125 Old Alabama Rd SE
- 101 Bevil Ridge Rd SE
- 49 Red Top Cir
- 97 Bevil Ridge Rd SE
- 124 Puckett Rd SE
- 139 Old Alabama Rd SE
- 0 11th St
- 135 Old Alabama Rd SE
- 520 Crown Dr
- 518 Crown Dr Unit 10
- 518 Crown Dr
- 516 Crown Dr
- 512 Crown Dr
- The Durant A Plan at Stegall Village
- The Monroe A Plan at Stegall Village
- The Wilmington A Plan at Stegall Village
- 481 Crown Dr
- 489 Crown Dr
- 14 Bevil Ridge Rd SE
- 40 Bevil Ridge Rd SE
- 373 Old Alabama Rd SE
- 70 Red Top Cir
- 77 Red Top Cir
- 11 Bevil Ridge Rd SE
- 45 Bevil Ridge Rd SE
- 45 Bevil Ridge Rd SE
- 45 Bevil Ridge Rd SE
- 362 Old Old Alabama Rd SE
- 10 Red Top Cir
- 370 Old Old Alabama Rd SE
- 374 Old Old Alabama Rd SE
- 75 Red Top Cir
- 50 Bevil Ridge Rd SE
- 12 Red Top Cir
- 11 Red Top Cir
- 73 Red Top Cir
- 386 Old Alabama Rd SE
- 386 Old Old Alabama Rd SE