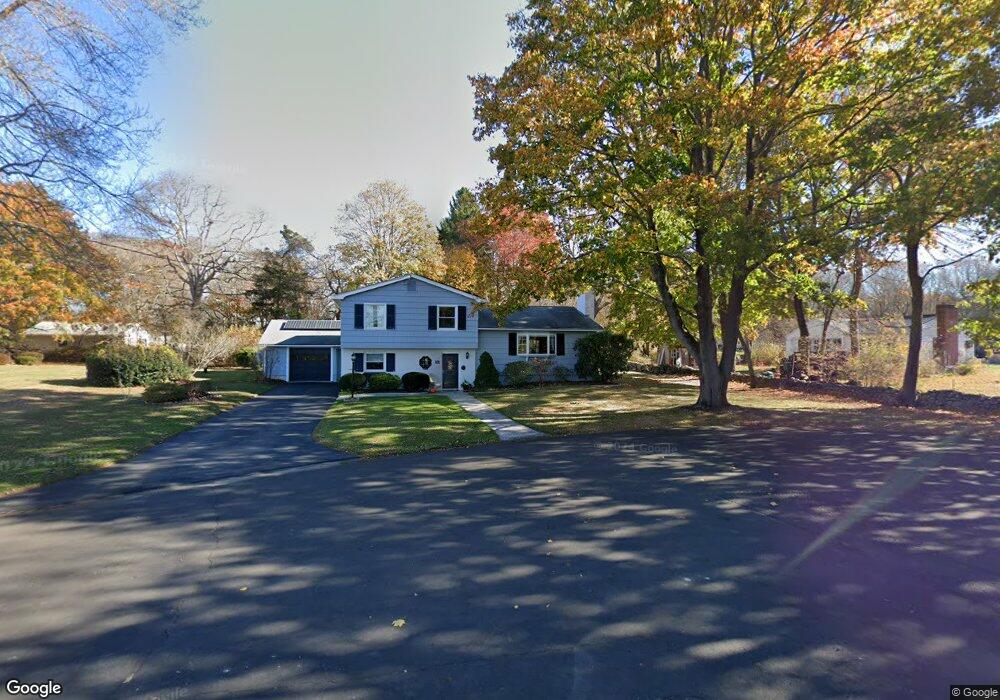
12 Birch St Niantic, CT 06357
Estimated Value: $543,594 - $659,000
4
Beds
3
Baths
1,296
Sq Ft
$458/Sq Ft
Est. Value
About This Home
This home is located at 12 Birch St, Niantic, CT 06357 and is currently estimated at $593,649, approximately $458 per square foot. 12 Birch St is a home located in New London County with nearby schools including East Lyme Middle School, East Lyme High School, and The Light House Voc-Ed Center.
Ownership History
Date
Name
Owned For
Owner Type
Purchase Details
Closed on
Mar 16, 2020
Sold by
Chantrell Elizabeth and Chantrell William
Bought by
William & E Chantrell Ret
Current Estimated Value
Purchase Details
Closed on
Mar 24, 1983
Bought by
Chantrell Wm C
Create a Home Valuation Report for This Property
The Home Valuation Report is an in-depth analysis detailing your home's value as well as a comparison with similar homes in the area
Home Values in the Area
Average Home Value in this Area
Purchase History
| Date | Buyer | Sale Price | Title Company |
|---|---|---|---|
| William & E Chantrell Ret | -- | None Available | |
| William & E Chantrell Ret | -- | None Available | |
| Chantrell Wm C | -- | -- |
Source: Public Records
Mortgage History
| Date | Status | Borrower | Loan Amount |
|---|---|---|---|
| Previous Owner | Chantrell Wm C | $110,000 | |
| Previous Owner | Chantrell Wm C | $100,000 | |
| Previous Owner | Chantrell Wm C | $50,000 |
Source: Public Records
Tax History
| Year | Tax Paid | Tax Assessment Tax Assessment Total Assessment is a certain percentage of the fair market value that is determined by local assessors to be the total taxable value of land and additions on the property. | Land | Improvement |
|---|---|---|---|---|
| 2025 | $6,382 | $227,850 | $89,250 | $138,600 |
| 2024 | $6,004 | $227,850 | $89,250 | $138,600 |
| 2023 | $5,669 | $227,850 | $89,250 | $138,600 |
| 2022 | $5,432 | $227,850 | $89,250 | $138,600 |
| 2021 | $4,452 | $156,170 | $85,190 | $70,980 |
| 2020 | $4,477 | $157,850 | $85,190 | $72,660 |
| 2019 | $4,450 | $157,850 | $85,190 | $72,660 |
| 2018 | $4,317 | $157,850 | $85,190 | $72,660 |
| 2017 | $4,129 | $157,850 | $85,190 | $72,660 |
| 2016 | $4,697 | $185,220 | $105,490 | $79,730 |
| 2015 | $4,577 | $185,220 | $105,490 | $79,730 |
| 2014 | $4,451 | $185,220 | $105,490 | $79,730 |
Source: Public Records
Map
Nearby Homes
- 26 Mohawk Dr
- 127 Black Point Rd Unit 7
- 36 Attawan Rd
- 19 Sapia Dr
- 42 S Washington Ave
- 12 Spinnaker Dr
- 61 Whitecap Rd
- 31 Regatta Dr
- 15 Griswold Rd
- 47 Village Crossing Unit 47
- 43 Village Crossing Unit 43
- 97 W Main St Unit 36
- 46 Village Crossing Unit 46
- 468 Main St Unit 318
- 468 Main St Unit 111
- 55 Corey Ln
- 43 Roxbury Ct
- 37 Stoneywood Dr
- 185 Main St Unit 301
- 185 Main St Unit 305
- 10 Barone Rd
- 6 Barone Rd
- 30 Old Black Point Rd
- 26 Old Black Point Rd
- 11 Birch St
- 9 Birch St
- 4 Barone Rd
- 28 Old Black Point Rd
- 34 Old Black Point Rd
- 9 Barone Rd
- 7 Barone Rd
- 8 Indian Rock Rd
- 6 Indian Rock Rd
- 24 Old Black Point Rd
- 10 Indian Rock Rd
- 5 Barone Rd
- 4 Indian Rock Rd
- 29 Old Black Point Rd
- 3 Barone Rd
- 2 Indian Rock Rd
Your Personal Tour Guide
Ask me questions while you tour the home.