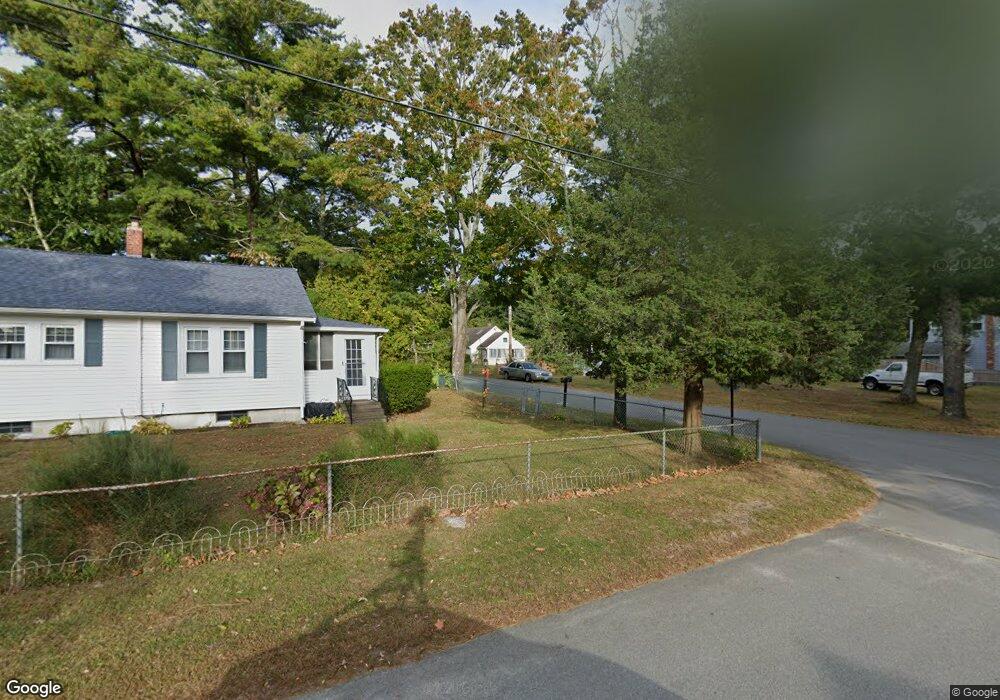
12 Birch St Wareham, MA 02571
Estimated Value: $364,000 - $402,000
2
Beds
2
Baths
834
Sq Ft
$459/Sq Ft
Est. Value
About This Home
This home is located at 12 Birch St, Wareham, MA 02571 and is currently estimated at $382,911, approximately $459 per square foot. 12 Birch St is a home located in Plymouth County.
Ownership History
Date
Name
Owned For
Owner Type
Purchase Details
Closed on
Jun 17, 1996
Sold by
Orpen Rt
Bought by
Sims Michele A
Current Estimated Value
Home Financials for this Owner
Home Financials are based on the most recent Mortgage that was taken out on this home.
Original Mortgage
$78,750
Interest Rate
7.97%
Mortgage Type
Purchase Money Mortgage
Create a Home Valuation Report for This Property
The Home Valuation Report is an in-depth analysis detailing your home's value as well as a comparison with similar homes in the area
Purchase History
| Date | Buyer | Sale Price | Title Company |
|---|---|---|---|
| Sims Michele A | $83,000 | -- | |
| Sims Michele A | $83,000 | -- |
Source: Public Records
Mortgage History
| Date | Status | Borrower | Loan Amount |
|---|---|---|---|
| Open | Sims Michele A | $60,000 | |
| Closed | Sims Michele A | $78,000 | |
| Closed | Sims Michele A | $78,750 |
Source: Public Records
Tax History
| Year | Tax Paid | Tax Assessment Tax Assessment Total Assessment is a certain percentage of the fair market value that is determined by local assessors to be the total taxable value of land and additions on the property. | Land | Improvement |
|---|---|---|---|---|
| 2025 | $3,271 | $313,900 | $125,100 | $188,800 |
| 2024 | $3,248 | $289,200 | $97,400 | $191,800 |
| 2023 | $3,093 | $257,100 | $88,600 | $168,500 |
| 2022 | $2,919 | $221,500 | $88,600 | $132,900 |
| 2021 | $0 | $215,300 | $88,600 | $126,700 |
| 2020 | $2,771 | $209,000 | $88,600 | $120,400 |
| 2019 | $2,642 | $198,800 | $84,200 | $114,600 |
| 2018 | $2,482 | $182,100 | $84,200 | $97,900 |
| 2017 | $2,393 | $177,900 | $84,200 | $93,700 |
| 2016 | $2,234 | $165,100 | $77,600 | $87,500 |
| 2015 | $2,158 | $165,100 | $77,600 | $87,500 |
| 2014 | $2,179 | $169,600 | $84,600 | $85,000 |
Source: Public Records
Map
Nearby Homes
- 3 Hazel St
- 4 Ross Ave
- 10 Oak St
- 106 Circuit Ave
- 55 Minot Ave Unit 55
- 6 Allen Ave
- 15 Broadmarsh Ave
- 43 Shore Ave
- 20 Grant St
- 6 Pine St
- 6 Wildwood Ave
- 21 Bayview St
- 10 Barnes St
- 4 Mather Dr
- 3 Cranberry Grove Way Unit C
- 156 Sandwich Rd
- 124 Minot Ave Unit 1
- 0 Squaw's Path
- 25 Linwood Ave
- 110 Mayflower Ridge Dr
Your Personal Tour Guide
Ask me questions while you tour the home.