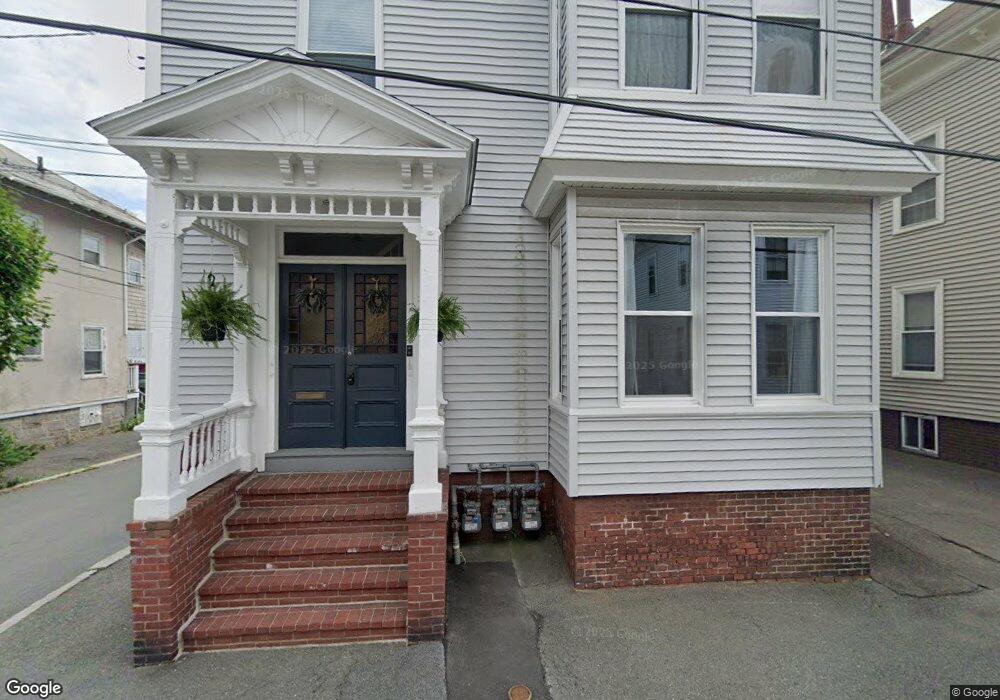
12 Boardman St Unit 3 Salem, MA 01970
Salem Common NeighborhoodEstimated Value: $417,000 - $543,000
2
Beds
1
Bath
1,185
Sq Ft
$419/Sq Ft
Est. Value
About This Home
This home is located at 12 Boardman St Unit 3, Salem, MA 01970 and is currently estimated at $496,684, approximately $419 per square foot. 12 Boardman St Unit 3 is a home located in Essex County with nearby schools including Carlton Elementary School, Saltonstall School, and Bates Elementary School.
Ownership History
Date
Name
Owned For
Owner Type
Purchase Details
Closed on
Oct 27, 2011
Sold by
Byrne Belinda M
Bought by
Nguyen Hang
Current Estimated Value
Home Financials for this Owner
Home Financials are based on the most recent Mortgage that was taken out on this home.
Original Mortgage
$193,600
Outstanding Balance
$132,589
Interest Rate
4.11%
Mortgage Type
Purchase Money Mortgage
Estimated Equity
$364,095
Purchase Details
Closed on
Mar 29, 2007
Sold by
Smith Alison M
Bought by
Byrne Belinda M
Home Financials for this Owner
Home Financials are based on the most recent Mortgage that was taken out on this home.
Original Mortgage
$265,000
Interest Rate
6.33%
Mortgage Type
Purchase Money Mortgage
Purchase Details
Closed on
May 26, 2004
Sold by
Ring David
Bought by
Smith Allison M
Home Financials for this Owner
Home Financials are based on the most recent Mortgage that was taken out on this home.
Original Mortgage
$207,200
Interest Rate
5.88%
Mortgage Type
Purchase Money Mortgage
Create a Home Valuation Report for This Property
The Home Valuation Report is an in-depth analysis detailing your home's value as well as a comparison with similar homes in the area
Home Values in the Area
Average Home Value in this Area
Purchase History
| Date | Buyer | Sale Price | Title Company |
|---|---|---|---|
| Nguyen Hang | $242,000 | -- | |
| Byrne Belinda M | $295,000 | -- | |
| Smith Allison M | $259,000 | -- |
Source: Public Records
Mortgage History
| Date | Status | Borrower | Loan Amount |
|---|---|---|---|
| Open | Smith Allison M | $193,600 | |
| Previous Owner | Smith Allison M | $265,000 | |
| Previous Owner | Smith Allison M | $38,600 | |
| Previous Owner | Smith Allison M | $207,200 |
Source: Public Records
Tax History
| Year | Tax Paid | Tax Assessment Tax Assessment Total Assessment is a certain percentage of the fair market value that is determined by local assessors to be the total taxable value of land and additions on the property. | Land | Improvement |
|---|---|---|---|---|
| 2025 | $4,504 | $397,200 | $0 | $397,200 |
| 2024 | $4,474 | $385,000 | $0 | $385,000 |
| 2023 | $4,577 | $365,900 | $0 | $365,900 |
| 2022 | $4,563 | $344,400 | $0 | $344,400 |
| 2021 | $4,328 | $313,600 | $0 | $313,600 |
| 2020 | $4,256 | $294,500 | $0 | $294,500 |
| 2019 | $4,136 | $273,900 | $0 | $273,900 |
| 2018 | $4,028 | $261,900 | $0 | $261,900 |
| 2017 | $3,975 | $250,600 | $0 | $250,600 |
| 2016 | $3,830 | $244,400 | $0 | $244,400 |
| 2015 | $3,707 | $225,900 | $0 | $225,900 |
Source: Public Records
Map
Nearby Homes
- 1 Boardman St Unit 6
- 7 Forrester St
- 40 Essex St Unit 2
- 21 Emerton St Unit 2
- 16 Bentley St Unit 3
- 7 Curtis St Unit 1
- 31 N Washington Square Unit 3
- 17 Webb St Unit 1
- 131 Derby St Unit 3F
- 8 Union St Unit 1
- 8 Webb St
- 129 Essex St Unit 8
- 225 Derby St Unit 503
- 11 Barton St
- 86 Wharf St Unit 6
- 11 Church St Unit 203
- 11 Church St Unit 703
- 65 Washington St Unit 512
- 7 Larkin Ln
- 49 Federal St Unit 2
- 12 Boardman St Unit 2
- 10 Boardman St
- 12 1/2 Boardman St Unit 2
- 12 1/2 Boardman St Unit 1
- 1 Emerton St
- 8 Boardman St
- 11 Boardman St
- 14 Boardman St
- 14 Boardman St Unit 2
- 14 Boardman St Unit 1
- 4 Emerton St Unit 1
- 2 Emerton St
- 13 Boardman St Unit 2
- 13 Boardman St Unit 1
- 13 Boardman St
- 2 Emerton St
- 9 Boardman St Unit 3
- 9 Boardman St Unit 2
- 9 Boardman St Unit 1
- 15 Boardman St
Your Personal Tour Guide
Ask me questions while you tour the home.