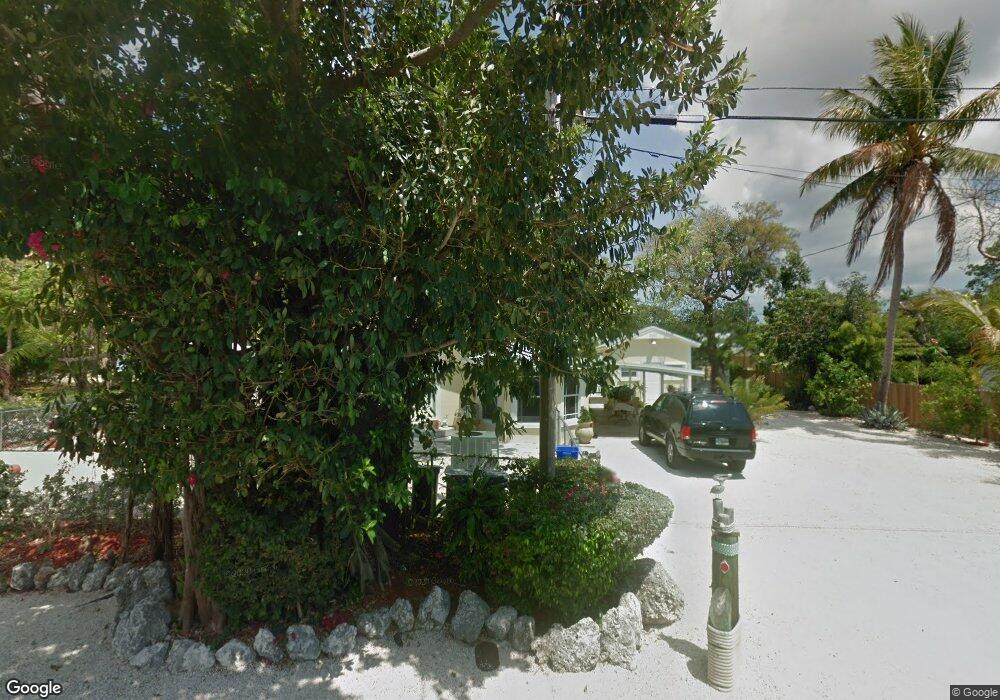
12 Bonefish Ave Key Largo, FL 33037
Estimated Value: $833,170 - $946,000
3
Beds
2
Baths
1,914
Sq Ft
$461/Sq Ft
Est. Value
About This Home
This home is located at 12 Bonefish Ave, Key Largo, FL 33037 and is currently estimated at $882,293, approximately $460 per square foot. 12 Bonefish Ave is a home located in Monroe County with nearby schools including Key Largo School, Coral Shores High School, and St. Justin Marine Academy.
Ownership History
Date
Name
Owned For
Owner Type
Purchase Details
Closed on
Feb 14, 2006
Sold by
Waananen Kenneth W and Waananen Carol J
Bought by
Quesada Samuel Ornelas and Ornelas Maria Elena
Current Estimated Value
Home Financials for this Owner
Home Financials are based on the most recent Mortgage that was taken out on this home.
Original Mortgage
$465,000
Outstanding Balance
$272,046
Interest Rate
6.87%
Mortgage Type
Fannie Mae Freddie Mac
Estimated Equity
$610,247
Purchase Details
Closed on
Apr 22, 2002
Sold by
Paul M Gould I
Bought by
Waananen Kenneth W and Waananen Carol J
Home Financials for this Owner
Home Financials are based on the most recent Mortgage that was taken out on this home.
Original Mortgage
$84,000
Interest Rate
6.89%
Purchase Details
Closed on
Jun 1, 1991
Bought by
Quesada Samuel Ornelas and Quesada Maria Elena
Purchase Details
Closed on
Feb 1, 1974
Bought by
Quesada Samuel Ornelas and Quesada Maria Elena
Create a Home Valuation Report for This Property
The Home Valuation Report is an in-depth analysis detailing your home's value as well as a comparison with similar homes in the area
Home Values in the Area
Average Home Value in this Area
Purchase History
| Date | Buyer | Sale Price | Title Company |
|---|---|---|---|
| Quesada Samuel Ornelas | $465,000 | Attorney | |
| Waananen Kenneth W | $179,000 | -- | |
| Quesada Samuel Ornelas | $93,000 | -- | |
| Quesada Samuel Ornelas | $32,500 | -- |
Source: Public Records
Mortgage History
| Date | Status | Borrower | Loan Amount |
|---|---|---|---|
| Open | Quesada Samuel Ornelas | $465,000 | |
| Previous Owner | Waananen Kenneth W | $84,000 |
Source: Public Records
Tax History Compared to Growth
Tax History
| Year | Tax Paid | Tax Assessment Tax Assessment Total Assessment is a certain percentage of the fair market value that is determined by local assessors to be the total taxable value of land and additions on the property. | Land | Improvement |
|---|---|---|---|---|
| 2024 | $3,063 | $342,453 | -- | -- |
| 2023 | $3,063 | $332,479 | $0 | $0 |
| 2022 | $2,906 | $322,796 | $0 | $0 |
| 2021 | $2,939 | $313,395 | $0 | $0 |
| 2020 | $2,922 | $309,069 | $0 | $0 |
| 2019 | $2,871 | $302,121 | $0 | $0 |
| 2018 | $2,866 | $296,488 | $0 | $0 |
| 2017 | $2,809 | $290,390 | $0 | $0 |
| 2016 | $2,842 | $284,418 | $0 | $0 |
| 2015 | $2,883 | $282,441 | $0 | $0 |
| 2014 | $2,942 | $280,199 | $0 | $0 |
Source: Public Records
Map
Nearby Homes
- 16 Jewfish Ave
- 35 Bass Ave
- 27 Blue Runner St
- 46 Snapper Ave
- 22 Snapper Ave
- 53 Bonefish Ave
- 55 Jewfish Ave
- 5 Blue Runner St
- 60 SE Marlin Ave
- 4 Snapper Ave
- 46 Transylvania Ave
- 48 Shoreland Dr
- 68 Bass Ave
- 16 Shoreland Dr
- 1515 Aqueduct Ln
- 180 Pompano Dr
- 338 Sound Dr
- 793 Oceana Ave
- 00 Bonita Ave
- 0 Bonita Ave