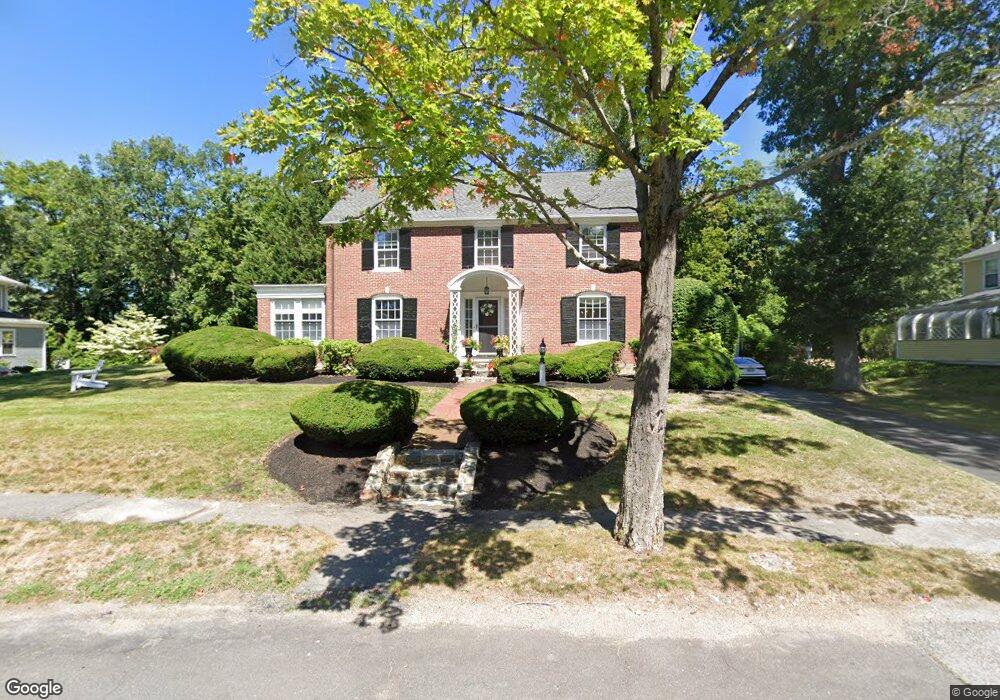
12 Bradford Rd Hingham, MA 02043
Estimated Value: $1,726,000 - $2,258,000
4
Beds
3
Baths
3,040
Sq Ft
$627/Sq Ft
Est. Value
About This Home
This home is located at 12 Bradford Rd, Hingham, MA 02043 and is currently estimated at $1,905,909, approximately $626 per square foot. 12 Bradford Rd is a home located in Plymouth County with nearby schools including William L. Foster Elementary School, Hingham Middle School, and Hingham High School.
Ownership History
Date
Name
Owned For
Owner Type
Purchase Details
Closed on
Aug 17, 2022
Sold by
Doran Maureen F and Doran Daniel P
Bought by
Doran Ft
Current Estimated Value
Purchase Details
Closed on
Nov 2, 2017
Sold by
Doran Daniel P and Doran Maureen F
Bought by
12 Bradford Road Rt
Purchase Details
Closed on
Oct 30, 2017
Sold by
12 Bradford Road Rt
Bought by
Doran Daniel P and Doran Maureen F
Purchase Details
Closed on
Nov 4, 2011
Sold by
12 Bradford Street Rt and Doran Maureen F
Bought by
Doran Maureen P and Doran Daniel P
Home Financials for this Owner
Home Financials are based on the most recent Mortgage that was taken out on this home.
Original Mortgage
$100,000
Interest Rate
4.08%
Mortgage Type
Purchase Money Mortgage
Purchase Details
Closed on
Sep 28, 2011
Sold by
Doran Daniel P and Doran Maureen F
Bought by
12 Bradford Road Rt and Doran Maureen F
Home Financials for this Owner
Home Financials are based on the most recent Mortgage that was taken out on this home.
Original Mortgage
$100,000
Interest Rate
4.08%
Mortgage Type
Purchase Money Mortgage
Purchase Details
Closed on
Aug 13, 2003
Sold by
Doran Maureen F and Doran Daniel P
Bought by
Doran Maureen F and 12 Bradford St Rt
Home Financials for this Owner
Home Financials are based on the most recent Mortgage that was taken out on this home.
Original Mortgage
$480,000
Interest Rate
5.46%
Mortgage Type
Purchase Money Mortgage
Purchase Details
Closed on
Jul 31, 1990
Sold by
Snyder Allen L
Bought by
Doran Daniel P
Create a Home Valuation Report for This Property
The Home Valuation Report is an in-depth analysis detailing your home's value as well as a comparison with similar homes in the area
Purchase History
We collect this data history from publicly available records. To have your information removed, we recommend requesting removal directly through your county’s website.
| Date | Buyer | Sale Price | Title Company |
|---|---|---|---|
| Doran Ft | -- | None Available | |
| 12 Bradford Road Rt | -- | None Available | |
| 12 Bradford Road Rt | -- | -- | |
| Doran Daniel P | -- | -- | |
| Doran Maureen P | -- | -- | |
| 12 Bradford Road Rt | -- | -- | |
| Doran Daniel P | -- | -- | |
| Doran Maureen F | -- | -- | |
| Doran Daniel P | $435,000 | -- |
Source: Public Records
Mortgage History
We collect this data history from publicly available records. To have your information removed, we recommend requesting removal directly through your county’s website.
| Date | Status | Borrower | Loan Amount |
|---|---|---|---|
| Previous Owner | Doran Maureen P | $100,000 | |
| Previous Owner | Doran Daniel P | $523,750 | |
| Previous Owner | Doran Daniel P | $100,000 | |
| Previous Owner | Doran Daniel P | $480,000 | |
| Previous Owner | Doran Daniel P | $455,000 |
Source: Public Records
Tax History
| Year | Tax Paid | Tax Assessment Tax Assessment Total Assessment is a certain percentage of the fair market value that is determined by local assessors to be the total taxable value of land and additions on the property. | Land | Improvement |
|---|---|---|---|---|
| 2025 | $15,713 | $1,469,900 | $726,400 | $743,500 |
| 2024 | $15,241 | $1,404,700 | $726,400 | $678,300 |
| 2023 | $13,432 | $1,343,200 | $726,400 | $616,800 |
| 2022 | $12,946 | $1,119,900 | $626,100 | $493,800 |
| 2021 | $12,702 | $1,076,400 | $626,100 | $450,300 |
| 2020 | $12,411 | $1,076,400 | $626,100 | $450,300 |
| 2019 | $12,371 | $1,047,500 | $626,100 | $421,400 |
| 2018 | $11,240 | $955,000 | $521,800 | $433,200 |
| 2017 | $11,374 | $928,500 | $542,600 | $385,900 |
| 2016 | $11,273 | $902,600 | $516,700 | $385,900 |
| 2015 | $10,996 | $877,600 | $491,700 | $385,900 |
Source: Public Records
Map
Nearby Homes
Your Personal Tour Guide
Ask me questions while you tour the home.