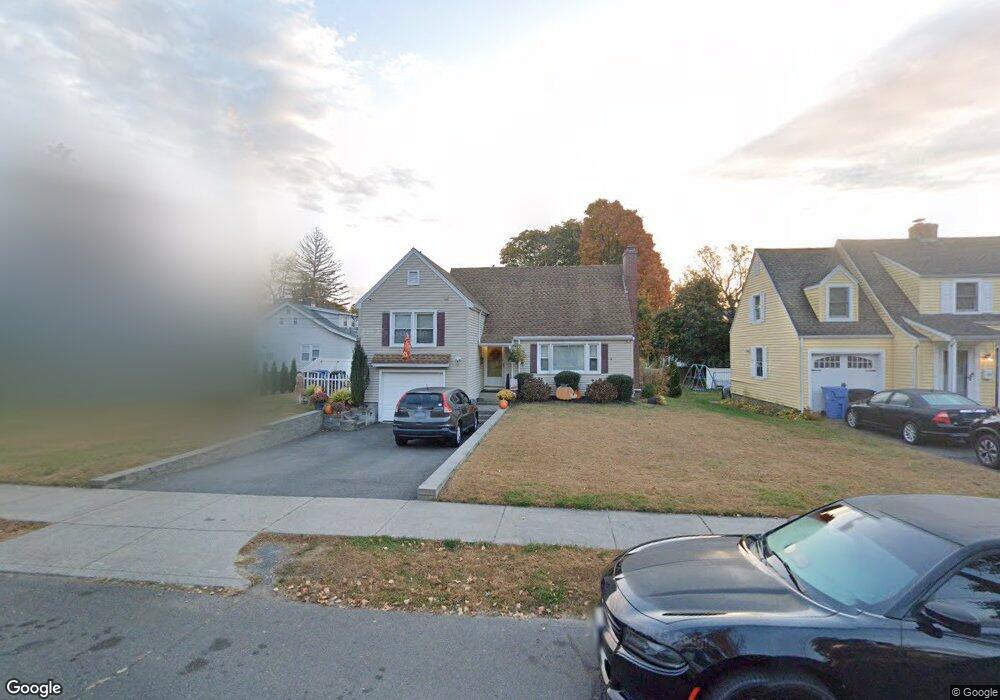
12 Brady Ave New Britain, CT 06052
Estimated Value: $324,000 - $344,000
3
Beds
2
Baths
1,605
Sq Ft
$209/Sq Ft
Est. Value
About This Home
This home is located at 12 Brady Ave, New Britain, CT 06052 and is currently estimated at $334,894, approximately $208 per square foot. 12 Brady Ave is a home located in Hartford County with nearby schools including Vance School, Slade Middle School, and Raymond Hill School.
Ownership History
Date
Name
Owned For
Owner Type
Purchase Details
Closed on
May 22, 2015
Sold by
Santos-Palmese Marilyn
Bought by
Santos-Palmese Marilyn and Palmese Neal J
Current Estimated Value
Purchase Details
Closed on
Apr 11, 2013
Sold by
Helfgott Arthur S and Helfgott Claudia I
Bought by
Santos Marilyn
Home Financials for this Owner
Home Financials are based on the most recent Mortgage that was taken out on this home.
Original Mortgage
$140,400
Interest Rate
3.55%
Create a Home Valuation Report for This Property
The Home Valuation Report is an in-depth analysis detailing your home's value as well as a comparison with similar homes in the area
Home Values in the Area
Average Home Value in this Area
Purchase History
| Date | Buyer | Sale Price | Title Company |
|---|---|---|---|
| Santos-Palmese Marilyn | -- | -- | |
| Santos Marilyn | $156,000 | -- |
Source: Public Records
Mortgage History
| Date | Status | Borrower | Loan Amount |
|---|---|---|---|
| Previous Owner | Santos Marilyn | $140,400 | |
| Previous Owner | Santos Marilyn | $86,000 | |
| Previous Owner | Santos Marilyn | $77,000 |
Source: Public Records
Tax History Compared to Growth
Tax History
| Year | Tax Paid | Tax Assessment Tax Assessment Total Assessment is a certain percentage of the fair market value that is determined by local assessors to be the total taxable value of land and additions on the property. | Land | Improvement |
|---|---|---|---|---|
| 2025 | $5,658 | $144,410 | $50,260 | $94,150 |
| 2024 | $5,717 | $144,410 | $50,260 | $94,150 |
| 2023 | $5,528 | $144,410 | $50,260 | $94,150 |
| 2022 | $5,128 | $103,600 | $23,170 | $80,430 |
| 2021 | $5,128 | $103,600 | $23,170 | $80,430 |
| 2020 | $5,232 | $103,600 | $23,170 | $80,430 |
| 2019 | $5,232 | $103,600 | $23,170 | $80,430 |
| 2018 | $5,232 | $103,600 | $23,170 | $80,430 |
| 2017 | $4,567 | $90,440 | $21,280 | $69,160 |
| 2016 | $4,567 | $90,440 | $21,280 | $69,160 |
| 2015 | $4,432 | $90,440 | $21,280 | $69,160 |
| 2014 | $4,432 | $90,440 | $21,280 | $69,160 |
Source: Public Records
Map
Nearby Homes
- 256 Hart St
- 423 Monroe St
- 73 Brooklawn St
- 300 Lincoln St
- 212 Lincoln St
- 100 Shuttle Meadow Ave
- 93 Winthrop St
- 112 Lincoln St
- 30 Norden St
- 66 Lincoln St
- 17 Kensington Ave
- 70 Monroe St
- 45 Park Place Unit 205
- 96 Garden St
- 300 W Main St
- 239 Glen St Unit 2A
- 14 Park Place Unit 4
- 235 W Main St
- 565 Lincoln St
- 78 Victoria Rd