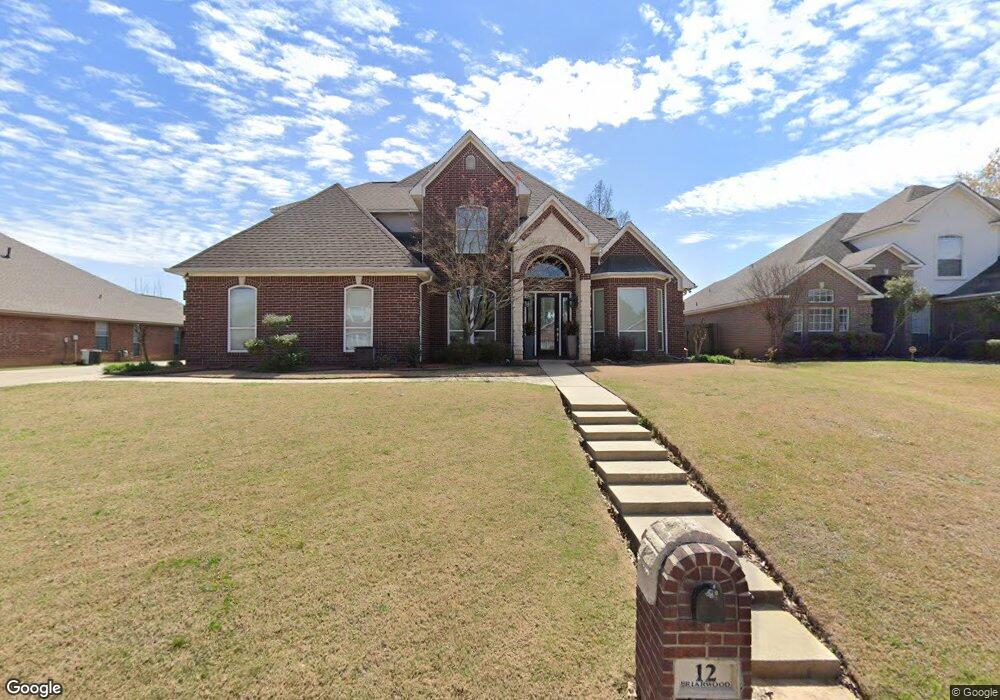
12 Briarwood Cir Texarkana, TX 75503
Estimated Value: $393,000 - $569,000
4
Beds
4
Baths
3,422
Sq Ft
$138/Sq Ft
Est. Value
About This Home
This home is located at 12 Briarwood Cir, Texarkana, TX 75503 and is currently estimated at $473,321, approximately $138 per square foot. 12 Briarwood Cir is a home located in Bowie County with nearby schools including Margaret Fischer Davis Elementary School, Pleasant Grove Intermediate School, and Pleasant Grove Middle School.
Ownership History
Date
Name
Owned For
Owner Type
Purchase Details
Closed on
Oct 1, 2015
Sold by
Carter William D and Carter Stacy L
Bought by
Reeves Austin and Reeves Karrie
Current Estimated Value
Home Financials for this Owner
Home Financials are based on the most recent Mortgage that was taken out on this home.
Original Mortgage
$327,121
Outstanding Balance
$257,457
Interest Rate
3.97%
Mortgage Type
Purchase Money Mortgage
Estimated Equity
$215,864
Purchase Details
Closed on
Sep 26, 2007
Sold by
Parsons Tom and Parsons Tobi
Bought by
Carter William D
Home Financials for this Owner
Home Financials are based on the most recent Mortgage that was taken out on this home.
Original Mortgage
$65,000
Interest Rate
6.48%
Mortgage Type
Future Advance Clause Open End Mortgage
Create a Home Valuation Report for This Property
The Home Valuation Report is an in-depth analysis detailing your home's value as well as a comparison with similar homes in the area
Home Values in the Area
Average Home Value in this Area
Purchase History
| Date | Buyer | Sale Price | Title Company |
|---|---|---|---|
| Reeves Austin | -- | None Available | |
| Carter William D | -- | None Available |
Source: Public Records
Mortgage History
| Date | Status | Borrower | Loan Amount |
|---|---|---|---|
| Open | Reeves Austin | $327,121 | |
| Previous Owner | Carter William D | $65,000 |
Source: Public Records
Tax History Compared to Growth
Tax History
| Year | Tax Paid | Tax Assessment Tax Assessment Total Assessment is a certain percentage of the fair market value that is determined by local assessors to be the total taxable value of land and additions on the property. | Land | Improvement |
|---|---|---|---|---|
| 2025 | $11,063 | $510,115 | $20,000 | $490,115 |
| 2024 | $11,063 | $497,113 | $20,000 | $477,113 |
| 2023 | $10,861 | $482,426 | $20,000 | $462,426 |
| 2022 | $10,747 | $437,687 | $20,000 | $417,687 |
| 2021 | $9,704 | $371,058 | $15,000 | $356,058 |
| 2020 | $9,293 | $353,506 | $15,000 | $338,506 |
| 2019 | $9,139 | $338,808 | $15,000 | $323,808 |
| 2018 | $8,927 | $332,795 | $15,000 | $317,795 |
| 2017 | $8,751 | $327,136 | $15,000 | $312,136 |
| 2016 | $8,751 | $327,136 | $15,000 | $312,136 |
| 2015 | $7,978 | $343,883 | $45,000 | $298,883 |
| 2014 | $7,978 | $315,937 | $25,000 | $290,937 |
Source: Public Records
Map
Nearby Homes
- 0 Briarwood Cir
- 36 Briarwood Cir
- 5703 Forest Grove Rd
- 5703 Sleepy Hollow Ave
- 6106 Sagebrush Ave
- 5902 Richmond Rd
- 5616 Deaton Place
- 5619 Deaton Place
- 5614 Deaton Place
- 5617 Deaton Place
- 4604 Suzanne Ave
- 6408 Prestige Ln
- TBD Lionel Ave
- Lot 2 Blk 2 Cooper Lane Est III
- 6703 Richmond Rd
- 5500 Pleasant Grove Rd
- 6108 Pebble Brook Dr
- 6203 Belair Dr
- 6814 Maple View Ln
- 6312 Chaparral St
- 10 Briarwood Cir
- 14 Briarwood Cir
- 16 Briarwood Cir
- 8 Briarwood Cir
- 13 Briarwood Cir
- 11 Briarwood Cir
- 15 Briarwood Cir
- 9 Briarwood Cir
- 6 Briarwood Cir
- 18 Briarwood Cir
- 17 Briarwood Cir
- 7 Briarwood Cir
- 25 Briarwood Cir
- 31 Briarwood Cir
- 27 Briarwood Cir
- 24 & 26 Briarwood Cir
- 24 &26 Briarwood Cir
- 26 Briarwood Cir
- 24 Briarwood Cir
- 28 Briarwood Cir