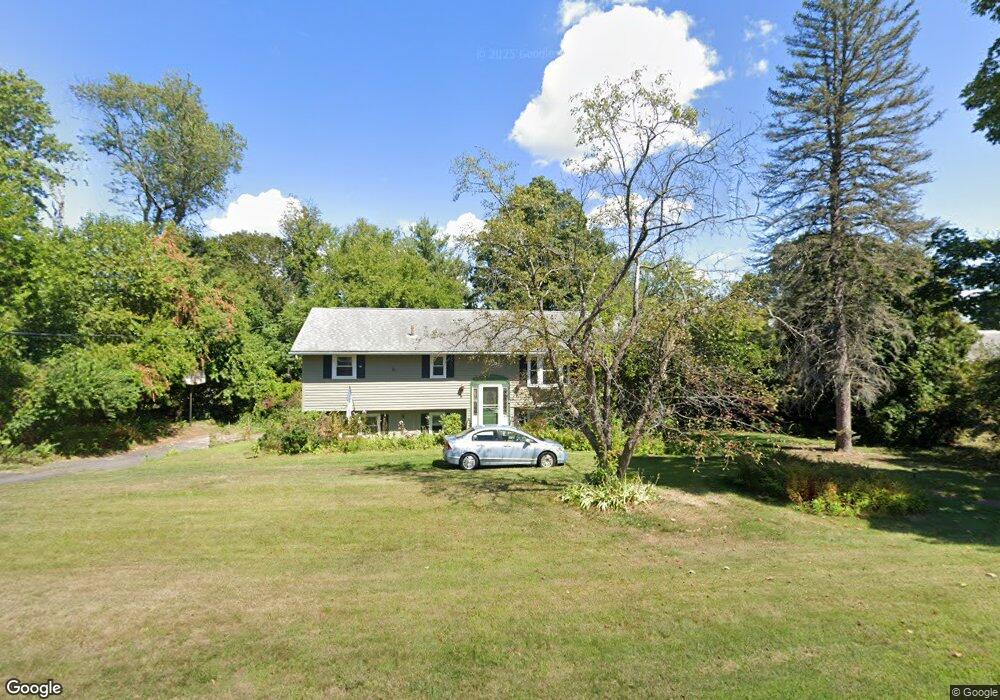
12 Bristol Ln Hadley, MA 01035
Estimated Value: $522,000 - $560,000
4
Beds
2
Baths
2,500
Sq Ft
$216/Sq Ft
Est. Value
About This Home
This home is located at 12 Bristol Ln, Hadley, MA 01035 and is currently estimated at $541,135, approximately $216 per square foot. 12 Bristol Ln is a home located in Hampshire County with nearby schools including Hadley Elementary School, Hopkins Academy, and Pioneer Valley Chinese Immersion Charter School.
Ownership History
Date
Name
Owned For
Owner Type
Purchase Details
Closed on
Jul 2, 2007
Sold by
Mahoney Sally Jane and Mahoney William G
Bought by
Jacobson Kenneth D
Current Estimated Value
Purchase Details
Closed on
Apr 26, 1995
Sold by
Devi Ranjana and Watson David J
Bought by
Mahoney Sally Jane and Mahoney William G
Create a Home Valuation Report for This Property
The Home Valuation Report is an in-depth analysis detailing your home's value as well as a comparison with similar homes in the area
Home Values in the Area
Average Home Value in this Area
Purchase History
We collect this data history from publicly available records. To have your information removed, we recommend requesting removal directly through your county’s website.
| Date | Buyer | Sale Price | Title Company |
|---|---|---|---|
| Jacobson Kenneth D | $310,000 | -- | |
| Mahoney Sally Jane | $165,000 | -- |
Source: Public Records
Mortgage History
We collect this data history from publicly available records. To have your information removed, we recommend requesting removal directly through your county’s website.
| Date | Status | Borrower | Loan Amount |
|---|---|---|---|
| Open | Mahoney Sally Jane | $547,500 | |
| Closed | Mahoney Sally Jane | $30,000 |
Source: Public Records
Tax History
| Year | Tax Paid | Tax Assessment Tax Assessment Total Assessment is a certain percentage of the fair market value that is determined by local assessors to be the total taxable value of land and additions on the property. | Land | Improvement |
|---|---|---|---|---|
| 2025 | $5,001 | $430,000 | $120,800 | $309,200 |
| 2024 | $4,726 | $414,900 | $120,800 | $294,100 |
| 2023 | $4,576 | $396,500 | $120,800 | $275,700 |
| 2022 | $4,197 | $344,600 | $120,800 | $223,800 |
| 2021 | $4,135 | $344,600 | $120,800 | $223,800 |
| 2020 | $4,187 | $327,600 | $120,800 | $206,800 |
| 2019 | $3,607 | $291,800 | $120,800 | $171,000 |
| 2018 | $3,446 | $285,000 | $120,800 | $164,200 |
| 2017 | $3,203 | $276,800 | $120,800 | $156,000 |
| 2016 | $3,086 | $276,800 | $120,800 | $156,000 |
| 2015 | $3,006 | $276,800 | $120,800 | $156,000 |
| 2014 | $2,945 | $276,800 | $120,800 | $156,000 |
Source: Public Records
Map
Nearby Homes
- 9 Meadowbrook Dr
- 1 Kozera Ave
- 64 N Maple St
- 277 River Dr
- 58 Main St Unit 3
- 136 Main St
- 15 Main St
- 9 Mill Valley Rd
- 30 Greenleaves Dr
- 23 Greenleaves Dr Unit 105
- 23 Greenleaves Dr Unit 107
- 27 Greenleaves Dr Unit 709
- 27 Greenleaves Dr Unit 726
- 26 Greenleaves Dr Unit 602
- 24 Greenleaves Dr Unit 413
- 24 Greenleaves Dr Unit 406
- 24 Greenleaves Dr Unit 416
- 91 Sunset Ave
- 0 Straits Rd
- 51 Jeffrey Ln
Your Personal Tour Guide
Ask me questions while you tour the home.