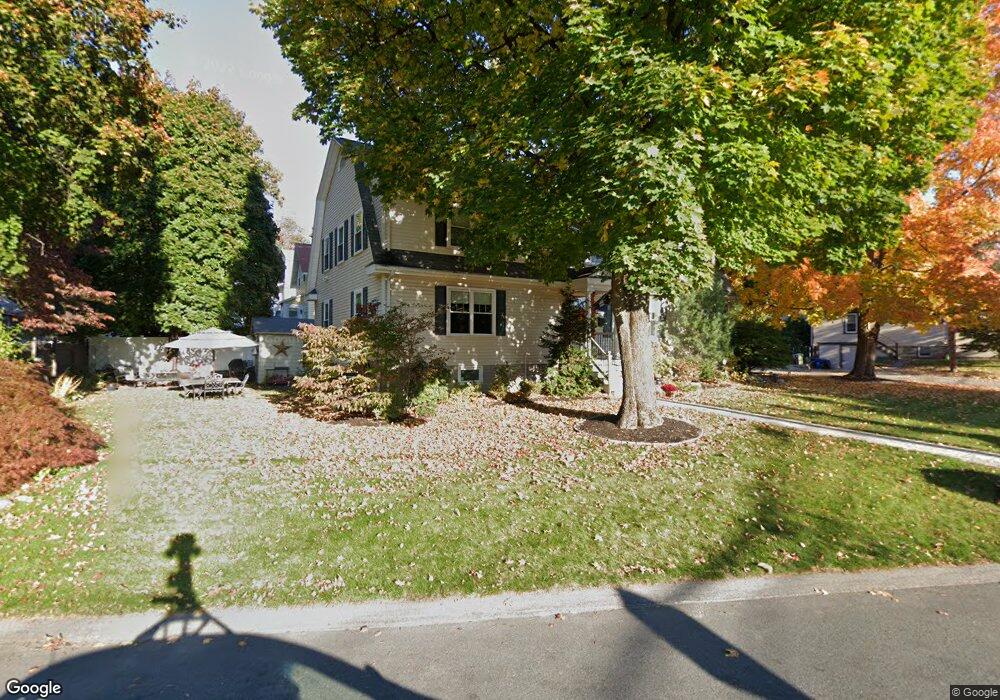
12 Brook St Wakefield, MA 01880
West Side NeighborhoodEstimated Value: $1,038,560 - $1,085,000
4
Beds
3
Baths
2,786
Sq Ft
$382/Sq Ft
Est. Value
About This Home
This home is located at 12 Brook St, Wakefield, MA 01880 and is currently estimated at $1,064,140, approximately $381 per square foot. 12 Brook St is a home located in Middlesex County with nearby schools including Wakefield Memorial High School, St Joseph School, and St. Patrick Elementary School.
Ownership History
Date
Name
Owned For
Owner Type
Purchase Details
Closed on
Nov 30, 1995
Sold by
Gardner James F and Gardner Susan M
Bought by
Ingalls Keith P and Ingalls Leslie E
Current Estimated Value
Home Financials for this Owner
Home Financials are based on the most recent Mortgage that was taken out on this home.
Original Mortgage
$160,000
Interest Rate
7.37%
Mortgage Type
Purchase Money Mortgage
Purchase Details
Closed on
Apr 19, 1991
Sold by
Gallant Allen R and Doherty Kevin J
Bought by
Gardner James F and Gardner Susan M
Create a Home Valuation Report for This Property
The Home Valuation Report is an in-depth analysis detailing your home's value as well as a comparison with similar homes in the area
Home Values in the Area
Average Home Value in this Area
Purchase History
| Date | Buyer | Sale Price | Title Company |
|---|---|---|---|
| Ingalls Keith P | $210,000 | -- | |
| Ingalls Keith P | $210,000 | -- | |
| Gardner James F | $181,000 | -- |
Source: Public Records
Mortgage History
| Date | Status | Borrower | Loan Amount |
|---|---|---|---|
| Open | Gardner James F | $348,000 | |
| Closed | Gardner James F | $20,000 | |
| Closed | Gardner James F | $160,000 |
Source: Public Records
Tax History
| Year | Tax Paid | Tax Assessment Tax Assessment Total Assessment is a certain percentage of the fair market value that is determined by local assessors to be the total taxable value of land and additions on the property. | Land | Improvement |
|---|---|---|---|---|
| 2025 | $10,347 | $911,600 | $397,200 | $514,400 |
| 2024 | $9,541 | $848,100 | $369,400 | $478,700 |
| 2023 | $9,288 | $791,800 | $344,800 | $447,000 |
| 2022 | $8,714 | $707,300 | $307,900 | $399,400 |
| 2021 | $8,437 | $662,800 | $281,500 | $381,300 |
| 2020 | $7,935 | $621,400 | $263,900 | $357,500 |
| 2019 | $7,441 | $580,000 | $246,300 | $333,700 |
| 2018 | $7,176 | $554,100 | $235,300 | $318,800 |
| 2017 | $6,747 | $517,800 | $219,900 | $297,900 |
| 2016 | $6,499 | $481,800 | $217,100 | $264,700 |
| 2015 | $6,071 | $450,400 | $202,900 | $247,500 |
| 2014 | $5,616 | $439,400 | $197,900 | $241,500 |
Source: Public Records
Map
Nearby Homes
- 1 Summit Dr Unit 57
- 2 Summit Dr Unit 43
- 403 Gazebo Cir
- 1010 Gazebo Cir
- 8 Parker Rd Unit 5
- 80 Redfield Rd
- 95 Prospect St
- 12 Isola Ln
- 66 Main St Unit 47A
- 10 Celestine Terrace
- 68 Main St Unit 21C
- 36 Pine Hill Cir
- 355 South St
- 62 High St Unit Lot 8
- 62 High St Unit 4
- 62 High St Unit Lot 5
- 62 High St Unit Lot 7
- 62 High St Unit Lot 12
- 62 High St Unit 3
- 313 South St
Your Personal Tour Guide
Ask me questions while you tour the home.