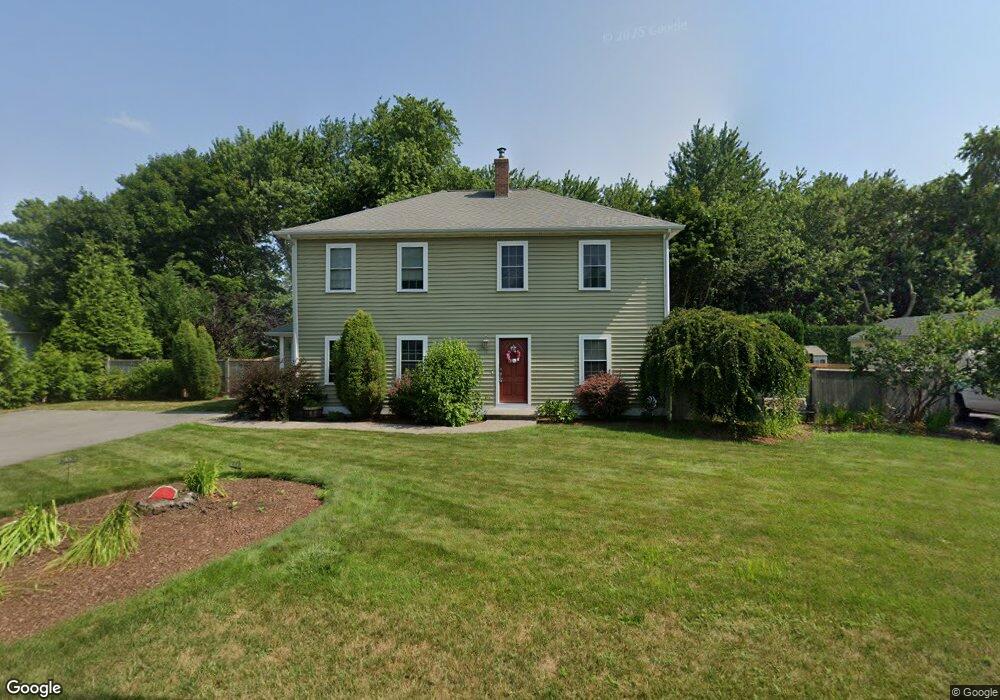
12 Bunker St Seekonk, MA 02771
Monroes-South Seekonk NeighborhoodEstimated Value: $475,000 - $573,000
3
Beds
3
Baths
2,003
Sq Ft
$261/Sq Ft
Est. Value
About This Home
This home is located at 12 Bunker St, Seekonk, MA 02771 and is currently estimated at $522,988, approximately $261 per square foot. 12 Bunker St is a home located in Bristol County with nearby schools including Seekonk High School, St Mary Academy-Bay View, and Providence Country Day School.
Ownership History
Date
Name
Owned For
Owner Type
Purchase Details
Closed on
Oct 24, 2000
Sold by
Andrade Rt
Bought by
Sirois Michael J
Current Estimated Value
Home Financials for this Owner
Home Financials are based on the most recent Mortgage that was taken out on this home.
Original Mortgage
$108,000
Interest Rate
7.88%
Mortgage Type
Purchase Money Mortgage
Create a Home Valuation Report for This Property
The Home Valuation Report is an in-depth analysis detailing your home's value as well as a comparison with similar homes in the area
Home Values in the Area
Average Home Value in this Area
Purchase History
| Date | Buyer | Sale Price | Title Company |
|---|---|---|---|
| Sirois Michael J | $120,000 | -- |
Source: Public Records
Mortgage History
| Date | Status | Borrower | Loan Amount |
|---|---|---|---|
| Open | Sirois Michael J | $192,300 | |
| Closed | Sirois Michael J | $106,000 | |
| Closed | Sirois Michael J | $108,000 |
Source: Public Records
Tax History Compared to Growth
Tax History
| Year | Tax Paid | Tax Assessment Tax Assessment Total Assessment is a certain percentage of the fair market value that is determined by local assessors to be the total taxable value of land and additions on the property. | Land | Improvement |
|---|---|---|---|---|
| 2025 | $5,648 | $457,300 | $142,500 | $314,800 |
| 2024 | $5,329 | $431,500 | $142,500 | $289,000 |
| 2023 | $5,161 | $393,700 | $127,300 | $266,400 |
| 2022 | $4,658 | $349,200 | $122,100 | $227,100 |
| 2021 | $4,475 | $329,800 | $108,100 | $221,700 |
| 2020 | $4,508 | $342,300 | $108,000 | $234,300 |
| 2019 | $4,264 | $326,500 | $101,500 | $225,000 |
| 2018 | $4,130 | $309,400 | $98,700 | $210,700 |
| 2017 | $3,951 | $293,500 | $96,300 | $197,200 |
| 2016 | $3,904 | $291,100 | $96,300 | $194,800 |
| 2015 | $3,778 | $285,600 | $96,300 | $189,300 |
Source: Public Records
Map
Nearby Homes