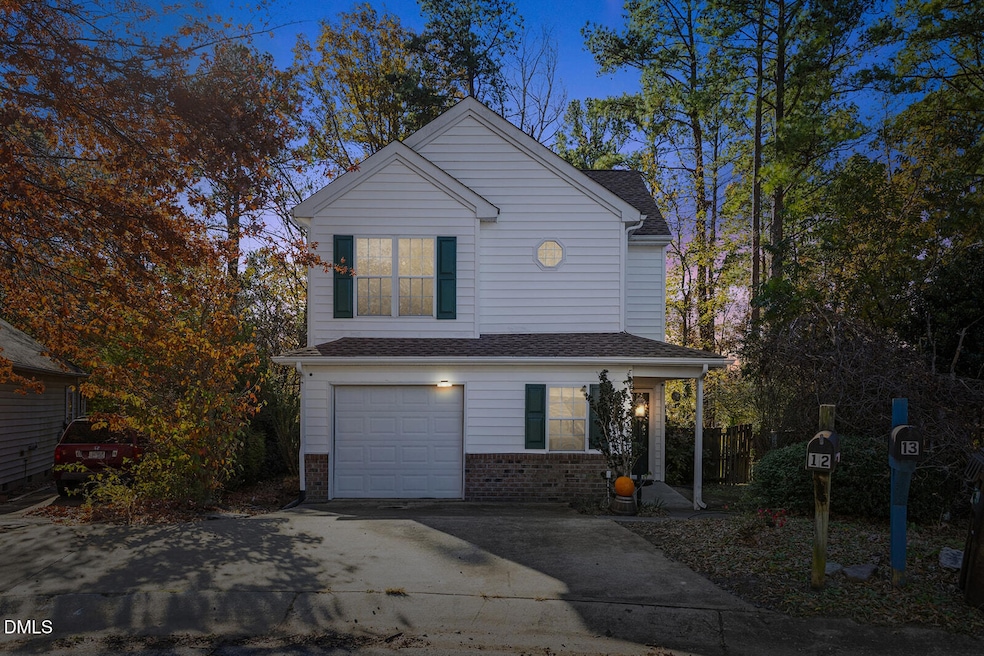
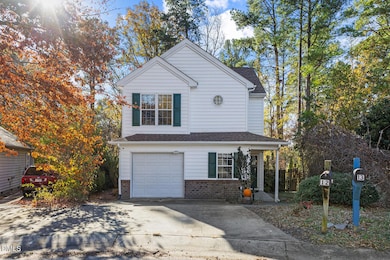


12 Byerly Ct Durham, NC 27713
Woodcroft NeighborhoodEstimated payment $2,177/month
Highlights
- Open Floorplan
- Deck
- Wood Flooring
- Pearsontown Elementary School Rated A-
- Transitional Architecture
- High Ceiling
About This Home
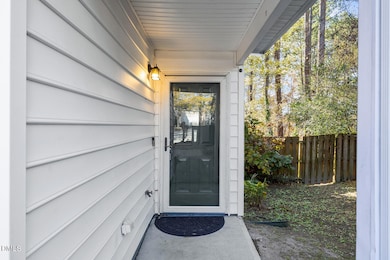
Located at the end of a quiet cul-de-sac in South Durham, this move-in-ready home combines smart updates with a functional layout. The main level features hardwood floors, a dedicated dining area, and a kitchen with granite countertops, stainless appliances, and a modern tile backsplash. Upstairs offers three comfortable bedrooms, including a spacious primary suite with a private bath and walk-in closet. Step outside to a pergola-covered deck and fully fenced, wooded backyard—ideal for relaxing or entertaining. Roof, windows, and HVAC all replaced within the last 2 years. Minutes to Southpoint, RTP, and major highways.
Home Details
Home Type
- Single Family
Est. Annual Taxes
- $4,212
Year Built
- Built in 1998
Lot Details
- 5,227 Sq Ft Lot
- Many Trees
- Back Yard Fenced and Front Yard
HOA Fees
- $25 Monthly HOA Fees
Parking
- 1 Car Attached Garage
- Front Facing Garage
- Private Driveway
- 2 Open Parking Spaces
Home Design
- Transitional Architecture
- Traditional Architecture
- Brick Exterior Construction
- Slab Foundation
- Shingle Roof
- Vinyl Siding
Interior Spaces
- 1,246 Sq Ft Home
- 2-Story Property
- Open Floorplan
- Smooth Ceilings
- High Ceiling
- Ceiling Fan
- Recessed Lighting
- Entrance Foyer
- Family Room
- Dining Room
- Storage
Kitchen
- Breakfast Bar
- Double Oven
- Indoor Grill
- Gas Range
- Plumbed For Ice Maker
- Dishwasher
- Stainless Steel Appliances
- Granite Countertops
Flooring
- Wood
- Tile
- Luxury Vinyl Tile
Bedrooms and Bathrooms
- 3 Bedrooms
- Primary bedroom located on second floor
- Walk-In Closet
- Separate Shower in Primary Bathroom
- Bathtub with Shower
- Separate Shower
Laundry
- Laundry on main level
- Washer and Electric Dryer Hookup
Attic
- Scuttle Attic Hole
- Unfinished Attic
Outdoor Features
- Deck
- Outdoor Grill
- Rain Gutters
- Front Porch
Schools
- Pearsontown Elementary School
- Lowes Grove Middle School
- Hillside High School
Utilities
- Forced Air Heating and Cooling System
- Heating System Uses Natural Gas
- Vented Exhaust Fan
- Gas Water Heater
Community Details
- Association fees include road maintenance
- Cedar Management Association, Phone Number (919) 348-2031
- Woodcreek Subdivision
Listing and Financial Details
- Assessor Parcel Number 0728-59-5538
Map
Home Values in the Area
Average Home Value in this Area
Tax History
| Year | Tax Paid | Tax Assessment Tax Assessment Total Assessment is a certain percentage of the fair market value that is determined by local assessors to be the total taxable value of land and additions on the property. | Land | Improvement |
|---|---|---|---|---|
| 2025 | $4,212 | $424,884 | $145,600 | $279,284 |
| 2024 | $2,894 | $207,504 | $39,340 | $168,164 |
| 2023 | $2,718 | $207,504 | $39,340 | $168,164 |
| 2022 | $2,656 | $207,504 | $39,340 | $168,164 |
| 2021 | $2,643 | $207,504 | $39,340 | $168,164 |
| 2020 | $2,581 | $207,504 | $39,340 | $168,164 |
| 2019 | $2,581 | $207,504 | $39,340 | $168,164 |
| 2018 | $2,325 | $171,373 | $28,100 | $143,273 |
| 2017 | $2,308 | $171,373 | $28,100 | $143,273 |
| 2016 | $2,230 | $171,373 | $28,100 | $143,273 |
| 2015 | $2,346 | $169,444 | $27,202 | $142,242 |
| 2014 | $2,346 | $169,444 | $27,202 | $142,242 |
Property History
| Date | Event | Price | List to Sale | Price per Sq Ft |
|---|---|---|---|---|
| 01/16/2026 01/16/26 | Price Changed | $349,999 | -2.8% | $281 / Sq Ft |
| 11/21/2025 11/21/25 | For Sale | $359,999 | -- | $289 / Sq Ft |
Purchase History
| Date | Type | Sale Price | Title Company |
|---|---|---|---|
| Warranty Deed | $210,000 | None Available | |
| Warranty Deed | $138,000 | -- | |
| Warranty Deed | $116,000 | -- |
Mortgage History
| Date | Status | Loan Amount | Loan Type |
|---|---|---|---|
| Previous Owner | $139,200 | VA | |
| Previous Owner | $116,000 | No Value Available |
Source: Doorify MLS
MLS Number: 10134313
APN: 147929
Disclaimer: Certain information contained herein is derived from information provided by parties other than Homes.com. All information provided is deemed reliable, but is not guaranteed to be accurate and should be independently verified.
![]() Some IDX listings have been excluded from this IDX display. Brokers make an effort to deliver accurate information, but buyers should independently verify any information on which they will rely in a transaction. The listing broker shall not be responsible for any typographical errors, misinformation, or misprints, and they shall be held totally harmless from any damages arising from reliance upon this data. This data is provided exclusively for consumers’ personal, non-commercial use. Listings marked with an icon are provided courtesy of the Doorify MLS, Inc. of North Carolina, Internet Data Exchange Database. Closed (sold) listings may have been listed and/or sold by a real estate firm other than the firm(s) featured on this website. Closed data is not available until the sale of the property is recorded in the MLS. Home sale data is not an appraisal, CMA, competitive or comparative market analysis, or home valuation of any property. Copyright 2026 Doorify MLS, Inc. of North Carolina. All rights reserved.
Some IDX listings have been excluded from this IDX display. Brokers make an effort to deliver accurate information, but buyers should independently verify any information on which they will rely in a transaction. The listing broker shall not be responsible for any typographical errors, misinformation, or misprints, and they shall be held totally harmless from any damages arising from reliance upon this data. This data is provided exclusively for consumers’ personal, non-commercial use. Listings marked with an icon are provided courtesy of the Doorify MLS, Inc. of North Carolina, Internet Data Exchange Database. Closed (sold) listings may have been listed and/or sold by a real estate firm other than the firm(s) featured on this website. Closed data is not available until the sale of the property is recorded in the MLS. Home sale data is not an appraisal, CMA, competitive or comparative market analysis, or home valuation of any property. Copyright 2026 Doorify MLS, Inc. of North Carolina. All rights reserved.
- 6502 Barbee Rd
- 5708 Catskill Ct
- 32 Brafferton Ct
- 10 Bridgeport Dr
- 1001 Pebble Creek Crossing Unit 11
- 11 Bridgeport Dr
- 1 Chownings St
- 6 Ozark Ct
- 545 Bluestone Rd
- 800 Bluestone Rd
- 8 Drummond Ct
- 1129 Pebble Creek Crossing
- 1303 Crimson Creek Dr
- 5511 Tahoe Dr
- 909 Windcrest Rd
- 804 Carpenter Fletcher Rd
- 806 Carpenter Fletcher Rd
- 63 Lake Village Dr
- 5315 Reams Run Rd
- 311 Ebon Rd
- 801 E Woodcroft Pkwy
- 5506 Grand Mesa Dr
- 1206 Maroon Dr Unit 4
- 5207 Tahoe Dr
- 5518 Tahoe Dr
- 1208 Mallory Ln
- 5128 Kemmont Dr
- 1101 Exchange Place
- 1000 Lydia's Way
- 531 Tuggle St
- 3115 Dunnock Dr
- 5800 Tattersall Dr
- 6201 Pine Glen Trail
- 1 Swiftstone Ct
- 3613 Sugar Tree Place
- 4512 Emerald Forest Dr
- 1415 E Nc 54 Hwy
- 1400 Laurel Springs Dr
- 1226 Catch Fly Ln
- 4405 Waterford Valley Dr

Ask me questions while you tour the home.