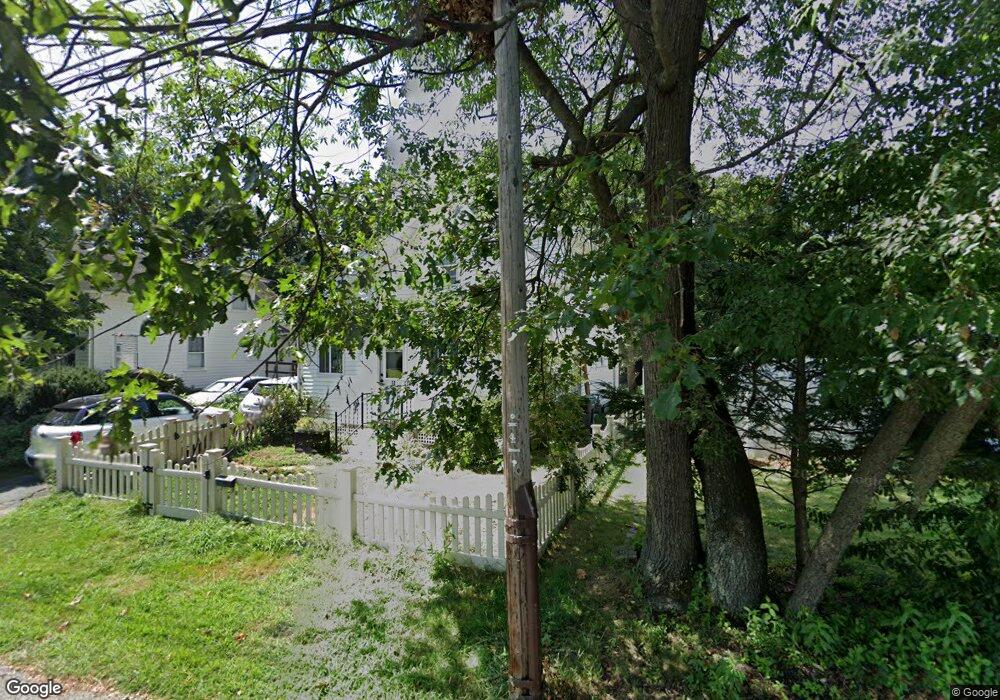
12 Byron Rd Natick, MA 01760
Estimated Value: $557,000 - $636,000
2
Beds
1
Bath
855
Sq Ft
$677/Sq Ft
Est. Value
About This Home
This home is located at 12 Byron Rd, Natick, MA 01760 and is currently estimated at $579,010, approximately $677 per square foot. 12 Byron Rd is a home located in Middlesex County with nearby schools including Natick High School, Wilson Middle School, and Bennett-Hemenway (Ben-Hem) Elementary School.
Ownership History
Date
Name
Owned For
Owner Type
Purchase Details
Closed on
Jul 31, 2015
Sold by
Young Richard K
Bought by
Blout Wei H
Current Estimated Value
Home Financials for this Owner
Home Financials are based on the most recent Mortgage that was taken out on this home.
Original Mortgage
$337,814
Outstanding Balance
$268,719
Interest Rate
4.37%
Mortgage Type
FHA
Estimated Equity
$310,291
Purchase Details
Closed on
Mar 18, 2005
Sold by
Winifred A Brock Rt
Bought by
Young Richard K
Home Financials for this Owner
Home Financials are based on the most recent Mortgage that was taken out on this home.
Original Mortgage
$235,200
Interest Rate
5.64%
Mortgage Type
Purchase Money Mortgage
Purchase Details
Closed on
Aug 4, 2004
Sold by
Brock Winifred A
Bought by
Lang John P and Mitchell Judith A
Create a Home Valuation Report for This Property
The Home Valuation Report is an in-depth analysis detailing your home's value as well as a comparison with similar homes in the area
Home Values in the Area
Average Home Value in this Area
Purchase History
| Date | Buyer | Sale Price | Title Company |
|---|---|---|---|
| Blout Wei H | $310,900 | -- | |
| Young Richard K | $294,000 | -- | |
| Lang John P | -- | -- |
Source: Public Records
Mortgage History
| Date | Status | Borrower | Loan Amount |
|---|---|---|---|
| Open | Blout Wei H | $337,814 | |
| Previous Owner | Young Richard K | $235,200 |
Source: Public Records
Tax History
| Year | Tax Paid | Tax Assessment Tax Assessment Total Assessment is a certain percentage of the fair market value that is determined by local assessors to be the total taxable value of land and additions on the property. | Land | Improvement |
|---|---|---|---|---|
| 2025 | $5,674 | $474,400 | $348,000 | $126,400 |
| 2024 | $5,562 | $453,700 | $334,900 | $118,800 |
| 2023 | $5,606 | $443,500 | $317,500 | $126,000 |
| 2022 | $5,424 | $406,600 | $291,400 | $115,200 |
| 2021 | $8,511 | $382,100 | $274,000 | $108,100 |
| 2020 | $8,705 | $369,100 | $261,000 | $108,100 |
| 2019 | $7,964 | $369,100 | $261,000 | $108,100 |
| 2018 | $4,351 | $333,400 | $261,000 | $72,400 |
| 2017 | $7,361 | $292,800 | $221,800 | $71,000 |
| 2016 | $3,357 | $247,400 | $191,400 | $56,000 |
| 2015 | $3,358 | $243,000 | $191,400 | $51,600 |
Source: Public Records
Map
Nearby Homes
Your Personal Tour Guide
Ask me questions while you tour the home.