12 Calvin St Sewaren, NJ 07077
Estimated Value: $564,000
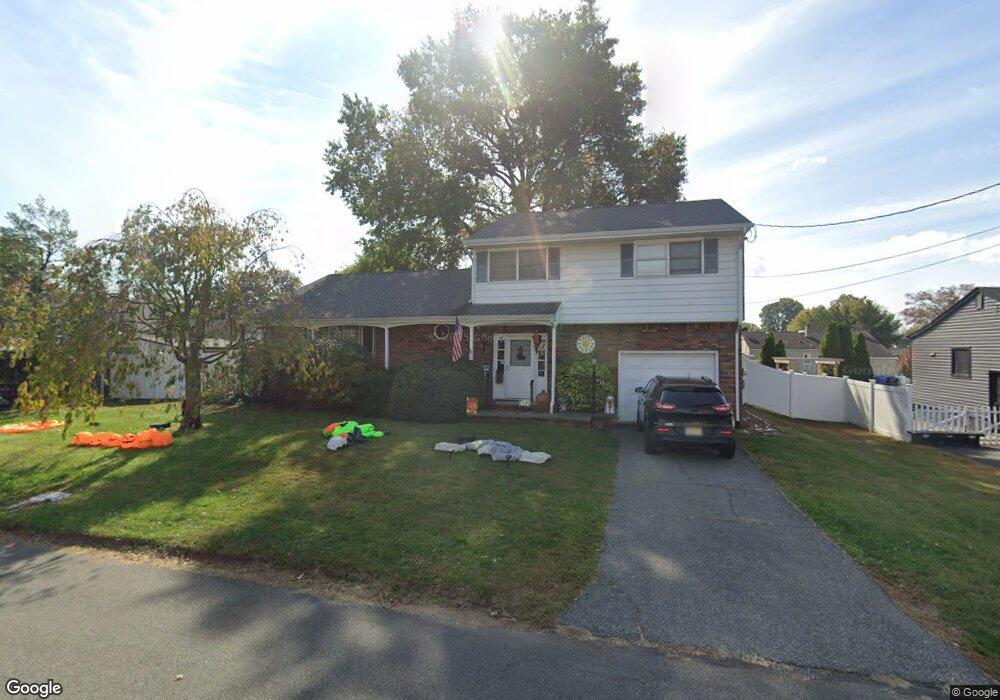
About This Home
As of April 2014This home is located at 12 Calvin St, Sewaren, NJ 07077 since 21 April 2014 and is currently estimated at $564,000. 12 Calvin St is a home located in Middlesex County with nearby schools including Matthew Jago Elementary School, Avenel Middle School, and Woodbridge High School.
Home Details
Home Type
- Single Family
Est. Annual Taxes
- $13,264
Lot Details
- 10,019 Sq Ft Lot
Bedrooms and Bathrooms
- 3 Bedrooms
- 3 Bathrooms
Ownership History
Purchase Details
Home Financials for this Owner
Home Financials are based on the most recent Mortgage that was taken out on this home.Purchase Details
Home Financials for this Owner
Home Financials are based on the most recent Mortgage that was taken out on this home.Home Values in the Area
Average Home Value in this Area
Purchase History
| Date | Buyer | Sale Price | Title Company |
|---|---|---|---|
| -- | -- | None Listed On Document | |
| -- | $260,000 | None Available |
Mortgage History
| Date | Status | Borrower | Loan Amount |
|---|---|---|---|
| Open | -- | $260,000 | |
| Previous Owner | -- | $25,974 |
Property History
| Date | Event | Price | List to Sale | Price per Sq Ft |
|---|---|---|---|---|
| 04/21/2014 04/21/14 | Sold | $260,000 | -- | -- |
Tax History Compared to Growth
Tax History
| Year | Tax Paid | Tax Assessment Tax Assessment Total Assessment is a certain percentage of the fair market value that is determined by local assessors to be the total taxable value of land and additions on the property. | Land | Improvement |
|---|---|---|---|---|
| 2025 | $13,264 | $98,000 | $22,000 | $76,000 |
| 2024 | $12,936 | $98,000 | $22,000 | $76,000 |
| 2023 | $12,936 | $98,000 | $22,000 | $76,000 |
| 2022 | $12,148 | $98,000 | $22,000 | $76,000 |
| 2021 | $12,023 | $98,000 | $22,000 | $76,000 |
| 2020 | $11,627 | $98,000 | $22,000 | $76,000 |
| 2019 | $11,332 | $98,000 | $22,000 | $76,000 |
| 2018 | $11,034 | $98,000 | $22,000 | $76,000 |
| 2017 | $10,811 | $98,000 | $22,000 | $76,000 |
| 2016 | $10,708 | $98,000 | $22,000 | $76,000 |
| 2015 | $10,498 | $98,000 | $22,000 | $76,000 |
| 2014 | $9,998 | $98,000 | $22,000 | $76,000 |
Map
Source: Garden State MLS
MLS Number: 3106409
APN: 25-00694-0000-00007
Disclaimer: Certain information contained herein is derived from information provided by parties other than Homes.com. All information provided is deemed reliable, but is not guaranteed to be accurate and should be independently verified.
![]() The data relating to real estate for sale on this website comes in part from the IDX Program of Garden State Multiple Listing Service, L.L.C. Real estate listings held by other brokerage firms are marked as IDX Listing.
The data relating to real estate for sale on this website comes in part from the IDX Program of Garden State Multiple Listing Service, L.L.C. Real estate listings held by other brokerage firms are marked as IDX Listing.
Information deemed reliable but not guaranteed.
Copyright © 2025 Garden State Multiple Listing Service, L.L.C. All rights reserved.
Notice: The dissemination of listings on this website does not constitute the consent required by N.J.A.C. 11:5.6.1 (n) for the advertisement of listings exclusively for sale by another broker. Any such consent must be obtained in writing from the listing broker.
This information is being provided for Consumers’ personal, non-commercial use and may not be used for any purpose other than to identify prospective properties Consumers may be interested in purchasing.