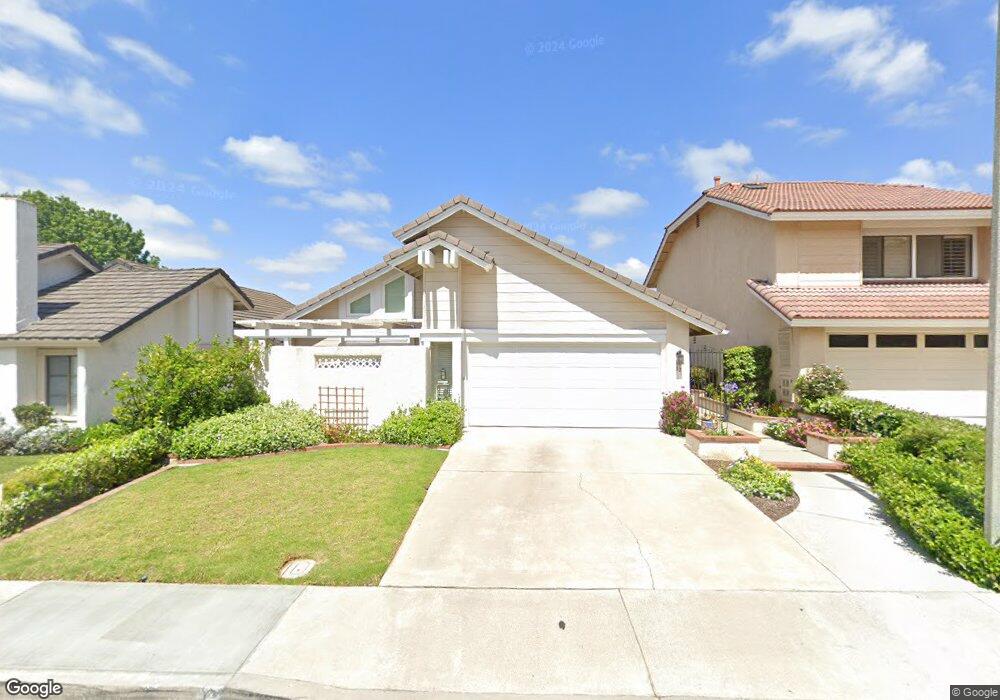
12 Campanero W Irvine, CA 92620
Northwood NeighborhoodEstimated Value: $1,282,235 - $1,884,000
3
Beds
2
Baths
1,323
Sq Ft
$1,137/Sq Ft
Est. Value
About This Home
This home is located at 12 Campanero W, Irvine, CA 92620 and is currently estimated at $1,504,559, approximately $1,137 per square foot. 12 Campanero W is a home located in Orange County with nearby schools including Santiago Hills Elementary School, Sierra Vista Middle School, and Northwood High School.
Ownership History
Date
Name
Owned For
Owner Type
Purchase Details
Closed on
Sep 18, 2018
Sold by
Kennington Milas H and Kennington Toni
Bought by
Kennington Milas H and Kennington Toni
Current Estimated Value
Purchase Details
Closed on
Apr 23, 1998
Sold by
Robert Whiteman
Bought by
Kennington Milas H and Kennington Toni
Home Financials for this Owner
Home Financials are based on the most recent Mortgage that was taken out on this home.
Original Mortgage
$235,350
Outstanding Balance
$44,794
Interest Rate
7.13%
Estimated Equity
$1,459,765
Create a Home Valuation Report for This Property
The Home Valuation Report is an in-depth analysis detailing your home's value as well as a comparison with similar homes in the area
Home Values in the Area
Average Home Value in this Area
Purchase History
We collect this data history from publicly available records. To have your information removed, we recommend requesting removal directly through your county’s website.
| Date | Buyer | Sale Price | Title Company |
|---|---|---|---|
| Kennington Milas H | -- | None Available | |
| Kennington Milas H | $261,500 | Guardian Title Company |
Source: Public Records
Mortgage History
We collect this data history from publicly available records. To have your information removed, we recommend requesting removal directly through your county’s website.
| Date | Status | Borrower | Loan Amount |
|---|---|---|---|
| Open | Kennington Milas H | $235,350 |
Source: Public Records
Tax History
| Year | Tax Paid | Tax Assessment Tax Assessment Total Assessment is a certain percentage of the fair market value that is determined by local assessors to be the total taxable value of land and additions on the property. | Land | Improvement |
|---|---|---|---|---|
| 2025 | $4,458 | $417,543 | $272,668 | $144,875 |
| 2024 | $4,458 | $409,356 | $267,321 | $142,035 |
| 2023 | $4,343 | $401,330 | $262,080 | $139,250 |
| 2022 | $4,257 | $393,461 | $256,941 | $136,520 |
| 2021 | $4,158 | $385,747 | $251,903 | $133,844 |
| 2020 | $4,134 | $381,792 | $249,320 | $132,472 |
| 2019 | $4,043 | $374,306 | $244,431 | $129,875 |
| 2018 | $3,970 | $366,967 | $239,638 | $127,329 |
| 2017 | $3,889 | $359,772 | $234,939 | $124,833 |
| 2016 | $3,720 | $352,718 | $230,332 | $122,386 |
| 2015 | $3,611 | $347,420 | $226,872 | $120,548 |
| 2014 | $3,542 | $340,615 | $222,428 | $118,187 |
Source: Public Records
Map
Nearby Homes
Your Personal Tour Guide
Ask me questions while you tour the home.