Estimated Value: $200,401 - $260,000
--
Bed
1
Bath
1,176
Sq Ft
$194/Sq Ft
Est. Value
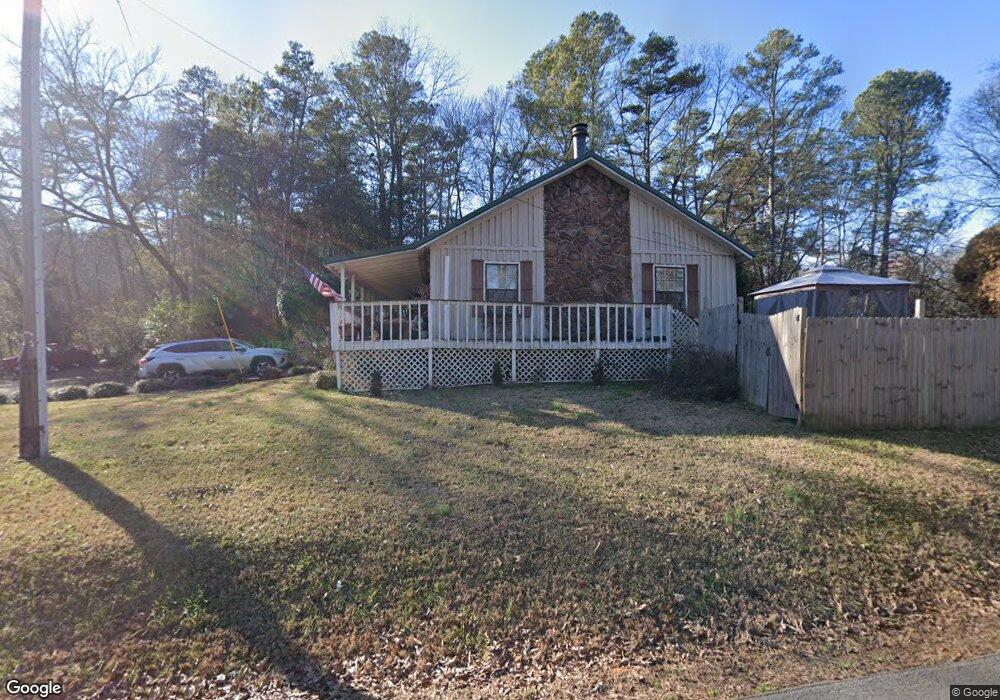
About This Home
This home is located at 12 Canard Rd SE, Rome, GA 30161 and is currently estimated at $227,850, approximately $193 per square foot. 12 Canard Rd SE is a home located in Floyd County with nearby schools including Model Middle School, Model High School, and Unity Christian School.
Ownership History
Date
Name
Owned For
Owner Type
Purchase Details
Closed on
Aug 24, 1999
Sold by
Farmer Tami
Bought by
Farmer Tami and Ashley Britt Farmer
Current Estimated Value
Purchase Details
Closed on
Jan 7, 1993
Sold by
Culberson Jackie C
Bought by
Culberson Jackie C and Culber Nancy L
Purchase Details
Closed on
Feb 15, 1990
Sold by
Womack Jimmy S and Womack Marjorie A
Bought by
Culberson Jackie C
Purchase Details
Closed on
Apr 26, 1985
Sold by
Womack Jimmy S
Bought by
Womack Jimmy S and Womack Marjorie A
Purchase Details
Closed on
Jul 25, 1980
Sold by
Taylor Willie R and Taylor Marie
Bought by
Womack Jimmy S
Purchase Details
Closed on
Aug 12, 1977
Sold by
Swann F K
Bought by
Taylor Willie R and Taylor Marie
Purchase Details
Closed on
Dec 10, 1976
Sold by
Kasonovitch Pete
Bought by
Swann F K
Purchase Details
Closed on
Jan 2, 1973
Sold by
Kasonovitch Devon
Bought by
Kasonovitch Pete
Purchase Details
Closed on
Mar 31, 1969
Sold by
Floyd Harry Est
Bought by
Kasonovitch Devon
Purchase Details
Closed on
Jan 1, 1959
Bought by
Floyd Harry Est
Create a Home Valuation Report for This Property
The Home Valuation Report is an in-depth analysis detailing your home's value as well as a comparison with similar homes in the area
Home Values in the Area
Average Home Value in this Area
Purchase History
| Date | Buyer | Sale Price | Title Company |
|---|---|---|---|
| Farmer Tami | -- | -- | |
| Farmer Tami | $71,000 | -- | |
| Culberson Jackie C | -- | -- | |
| Culberson Jackie C | $66,000 | -- | |
| Womack Jimmy S | -- | -- | |
| Womack Jimmy S | -- | -- | |
| Taylor Willie R | -- | -- | |
| Swann F K | -- | -- | |
| Kasonovitch Pete | -- | -- | |
| Kasonovitch Devon | -- | -- | |
| Floyd Harry Est | -- | -- |
Source: Public Records
Tax History Compared to Growth
Tax History
| Year | Tax Paid | Tax Assessment Tax Assessment Total Assessment is a certain percentage of the fair market value that is determined by local assessors to be the total taxable value of land and additions on the property. | Land | Improvement |
|---|---|---|---|---|
| 2024 | $1,458 | $69,637 | $5,668 | $63,969 |
| 2023 | $1,292 | $58,821 | $4,796 | $54,025 |
| 2022 | $1,183 | $50,868 | $3,924 | $46,944 |
| 2021 | $997 | $40,526 | $3,924 | $36,602 |
| 2020 | $905 | $35,081 | $3,052 | $32,029 |
| 2019 | $876 | $33,989 | $3,052 | $30,937 |
| 2018 | $858 | $32,883 | $3,052 | $29,831 |
| 2017 | $833 | $31,386 | $3,052 | $28,334 |
| 2016 | $840 | $31,214 | $3,040 | $28,174 |
| 2015 | $824 | $31,214 | $3,040 | $28,174 |
| 2014 | $824 | $31,214 | $3,040 | $28,174 |
Source: Public Records
Map
Nearby Homes
- 21 Everwood Ct SE
- 30 Mountain Creek Dr SE
- 0 Fallen Branch Cir SE Unit 7397536
- 0 Fallen Branch Cir SE Unit 10311756
- 0 Fallen Branch Cir SE Unit 7234792
- 0 Fallen Branch Cir SE Unit 10172755
- 16 Fallen Branch Cir SE
- 406 Fred Kelly Rd NE
- 1 Outpost Trail SE
- 0 Mountain Creek Dr SE Unit 10436191
- 3 Outpost Trail SE
- 158 Sproull Rd SE
- 0 N Quarters Dr Unit 7467468
- 0 N Quarters Dr Unit 37 10390869
- 567 Fred Kelley Rd NE
- 45 Wildflower Rd NE
- 7 Trimble Way SE
- 818 Morrison Camp Ground Rd NE
- 139 Shoals Ferry Rd SE
- 127 Branson Rd SE
- 2836 Kingston Hwy SE
- 2836 Kingston Hwy SE
- 15 Canard Rd SE
- 2843 Kingston Hwy NE
- 2843 Kingston Hwy NE
- 2875 Kingston Hwy NE
- 30 Canard Rd SE
- 35 Canard Rd SE
- 2851 Kingston Hwy NE
- 2833 Kingston Hwy NE
- 2861 Kingston Hwy NE
- 2904 Kingston Hwy SE
- 2821 Kingston Hwy NE
- 2885 Kingston Hwy NE
- 2885 Kingston Hwy NE
- 49 Canard Rd SE
- 2798 Kingston Hwy SE
- 2914 Kingston Hwy SE
- 12 Parkwood Dr NE
- 10 Parkwood Dr NE