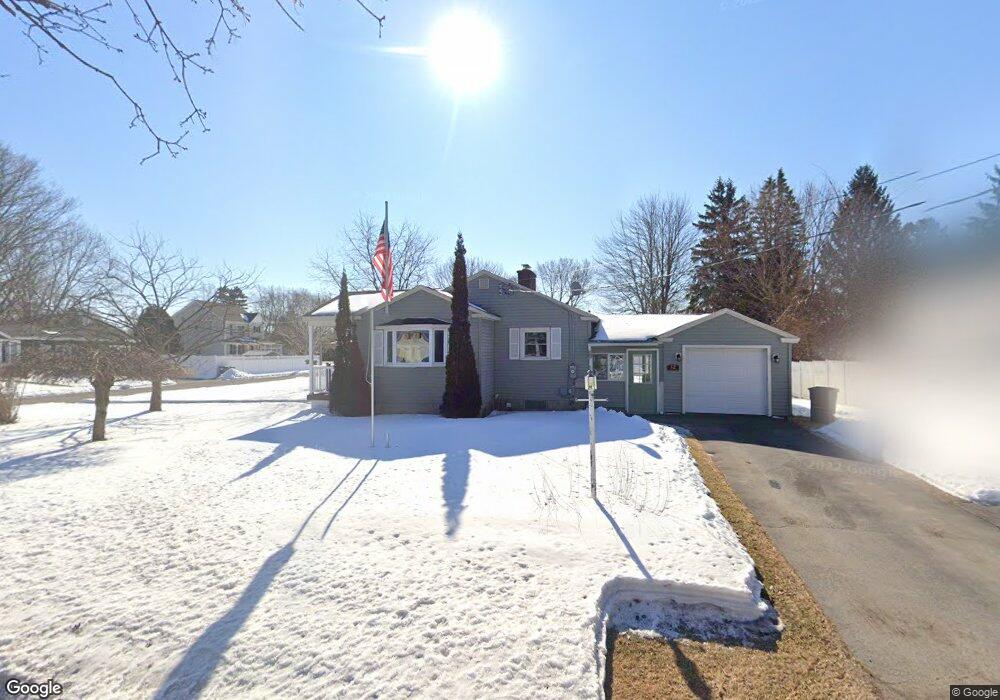
12 Carleton Ct Glens Falls, NY 12801
Estimated Value: $244,000 - $298,000
3
Beds
1
Bath
1,108
Sq Ft
$244/Sq Ft
Est. Value
About This Home
This home is located at 12 Carleton Ct, Glens Falls, NY 12801 and is currently estimated at $270,106, approximately $243 per square foot. 12 Carleton Ct is a home located in Warren County with nearby schools including Glens Falls Senior High School and St. Mary's - St. Alphonsus Regional Catholic School.
Ownership History
Date
Name
Owned For
Owner Type
Purchase Details
Closed on
Nov 30, 2011
Sold by
Hubinger John
Bought by
Vadnais Larry
Current Estimated Value
Home Financials for this Owner
Home Financials are based on the most recent Mortgage that was taken out on this home.
Original Mortgage
$133,527
Outstanding Balance
$87,146
Interest Rate
4.25%
Mortgage Type
FHA
Estimated Equity
$182,960
Purchase Details
Closed on
Mar 15, 2001
Sold by
Murray Eileen D
Bought by
Hubinger John C
Create a Home Valuation Report for This Property
The Home Valuation Report is an in-depth analysis detailing your home's value as well as a comparison with similar homes in the area
Home Values in the Area
Average Home Value in this Area
Purchase History
| Date | Buyer | Sale Price | Title Company |
|---|---|---|---|
| Vadnais Larry | $137,000 | Timothy Alden | |
| Hubinger John C | $69,500 | Leslie Ryan |
Source: Public Records
Mortgage History
| Date | Status | Borrower | Loan Amount |
|---|---|---|---|
| Open | Vadnais Larry | $133,527 |
Source: Public Records
Tax History
| Year | Tax Paid | Tax Assessment Tax Assessment Total Assessment is a certain percentage of the fair market value that is determined by local assessors to be the total taxable value of land and additions on the property. | Land | Improvement |
|---|---|---|---|---|
| 2024 | $5,789 | $208,600 | $57,000 | $151,600 |
| 2023 | $5,689 | $198,700 | $57,000 | $141,700 |
| 2022 | $4,758 | $198,700 | $57,000 | $141,700 |
| 2021 | $4,368 | $111,100 | $21,900 | $89,200 |
| 2020 | $4,343 | $111,100 | $21,900 | $89,200 |
| 2019 | $2,085 | $111,100 | $21,900 | $89,200 |
| 2018 | $2,085 | $111,100 | $21,900 | $89,200 |
| 2017 | $2,060 | $111,100 | $21,900 | $89,200 |
| 2016 | $4,105 | $111,100 | $21,900 | $89,200 |
| 2015 | -- | $111,100 | $21,900 | $89,200 |
| 2014 | -- | $111,100 | $21,900 | $89,200 |
Source: Public Records
Map
Nearby Homes
Your Personal Tour Guide
Ask me questions while you tour the home.