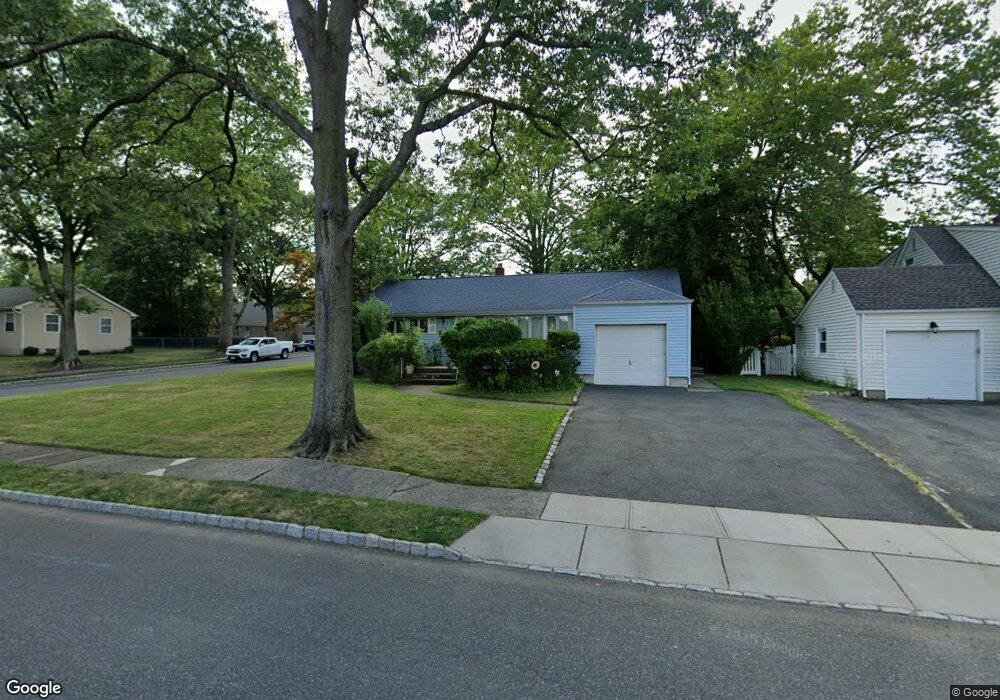
12 Carlton Dr Montclair, NJ 07043
Estimated Value: $647,115 - $1,014,000
Studio
--
Bath
1,104
Sq Ft
$720/Sq Ft
Est. Value
About This Home
This home is located at 12 Carlton Dr, Montclair, NJ 07043 and is currently estimated at $795,029, approximately $720 per square foot. 12 Carlton Dr is a home located in Essex County with nearby schools including Bradford School, Hillside School, and Nishuane School.
Ownership History
Date
Name
Owned For
Owner Type
Purchase Details
Closed on
Nov 24, 2014
Sold by
Fahlstedt Annelie ,Little P
Bought by
Fahlstedt Annelie
Current Estimated Value
Purchase Details
Closed on
Jun 24, 2010
Sold by
Fahlstedt Annelie
Bought by
Fahlstedt Annelie and Little Patrick
Home Financials for this Owner
Home Financials are based on the most recent Mortgage that was taken out on this home.
Original Mortgage
$150,900
Interest Rate
4.27%
Mortgage Type
New Conventional
Purchase Details
Closed on
Oct 4, 2002
Sold by
Fahlstedt Annelie
Bought by
Fahlstedt Annelie
Purchase Details
Closed on
May 29, 1996
Sold by
Mccarthy Lawrence
Bought by
Johansen Mark and Fahlstedt Annelie
Create a Home Valuation Report for This Property
The Home Valuation Report is an in-depth analysis detailing your home's value as well as a comparison with similar homes in the area
Home Values in the Area
Average Home Value in this Area
Purchase History
| Date | Buyer | Sale Price | Title Company |
|---|---|---|---|
| Fahlstedt Annelie | -- | -- | |
| Fahlstedt Annelie | -- | -- | |
| Fahlstedt Annelie | -- | New Bridge Title Agency | |
| Fahlstedt Annelie | -- | -- | |
| Johansen Mark | $189,000 | -- |
Source: Public Records
Mortgage History
| Date | Status | Borrower | Loan Amount |
|---|---|---|---|
| Previous Owner | Fahlstedt Annelie | $150,900 |
Source: Public Records
Tax History
| Year | Tax Paid | Tax Assessment Tax Assessment Total Assessment is a certain percentage of the fair market value that is determined by local assessors to be the total taxable value of land and additions on the property. | Land | Improvement |
|---|---|---|---|---|
| 2025 | $14,208 | $417,500 | $216,000 | $201,500 |
| 2024 | $14,112 | $417,500 | $216,000 | $201,500 |
| 2022 | $13,727 | $417,500 | $216,000 | $201,500 |
| 2021 | $13,489 | $417,500 | $216,000 | $201,500 |
| 2020 | $13,272 | $417,500 | $216,000 | $201,500 |
| 2019 | $13,135 | $417,500 | $216,000 | $201,500 |
| 2018 | $12,917 | $417,500 | $216,000 | $201,500 |
| 2017 | $12,729 | $340,900 | $212,000 | $128,900 |
| 2016 | $12,388 | $340,900 | $212,000 | $128,900 |
| 2015 | $12,020 | $340,900 | $212,000 | $128,900 |
| 2014 | $11,618 | $340,900 | $212,000 | $128,900 |
Source: Public Records
Map
Nearby Homes
- 33 Tuers Place
- 24 Malcolm Ct
- 34 Carline Dr
- 117 Yantacaw Brook Rd
- 70 Anderson Dr
- 112 Heller Way
- 1552 Broad St Rear
- 11 Kenneth Rd
- 40 Golf Rd
- 138 Alexander Ave
- 45 Wells Ct
- 18 Roy Ct
- 5 Bellevue Ave
- 8 MacOpin Ave
- 35 Chanda Ct Unit D035
- 35 Chanda Ct
- 34 Chanda Ct
- 34 Chanda Ct Unit D034
- 66 Lockwood Place
- 37 Chanda Ct
Your Personal Tour Guide
Ask me questions while you tour the home.