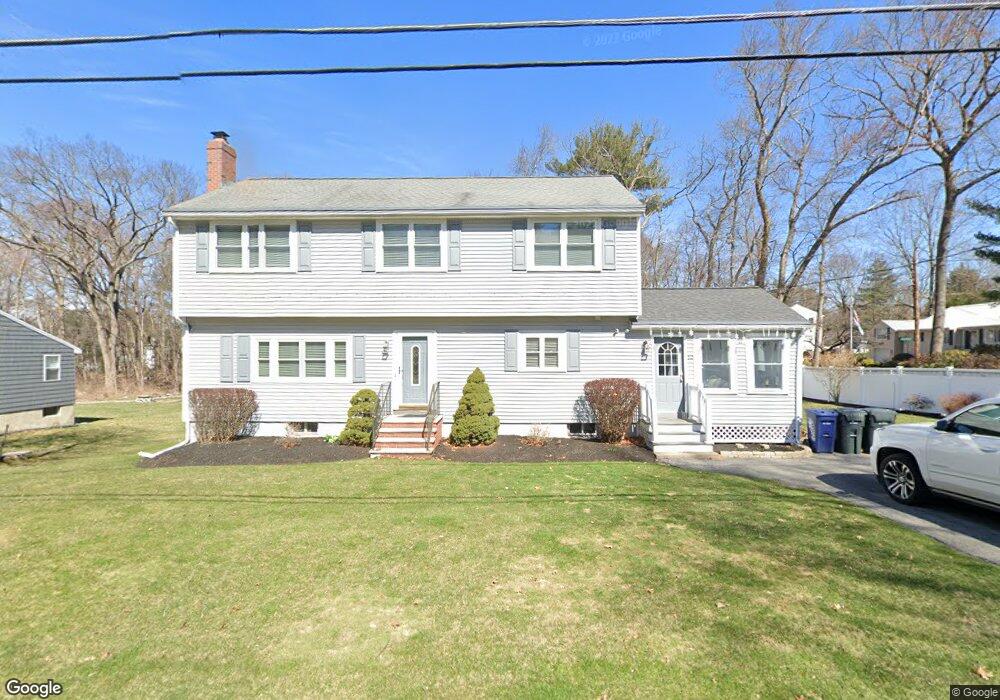
12 Carolyn Rd Wilmington, MA 01887
North Wilmington NeighborhoodEstimated Value: $821,190 - $895,000
3
Beds
2
Baths
2,212
Sq Ft
$390/Sq Ft
Est. Value
About This Home
This home is located at 12 Carolyn Rd, Wilmington, MA 01887 and is currently estimated at $861,798, approximately $389 per square foot. 12 Carolyn Rd is a home located in Middlesex County with nearby schools including Wilmington Middle School, Wilmington High School, and Abundant Life Christian School and Childcare.
Ownership History
Date
Name
Owned For
Owner Type
Purchase Details
Closed on
Oct 6, 2017
Sold by
Rutledge Donna M and Bornstein Matthew C
Bought by
Bornstein Jamie A
Current Estimated Value
Purchase Details
Closed on
Mar 14, 2003
Sold by
Rutledge Donna M
Bought by
Rutledge Donna M
Home Financials for this Owner
Home Financials are based on the most recent Mortgage that was taken out on this home.
Original Mortgage
$275,000
Interest Rate
5.94%
Create a Home Valuation Report for This Property
The Home Valuation Report is an in-depth analysis detailing your home's value as well as a comparison with similar homes in the area
Home Values in the Area
Average Home Value in this Area
Purchase History
| Date | Buyer | Sale Price | Title Company |
|---|---|---|---|
| Bornstein Jamie A | -- | -- | |
| Rutledge Donna M | -- | -- |
Source: Public Records
Mortgage History
| Date | Status | Borrower | Loan Amount |
|---|---|---|---|
| Previous Owner | Rutledge Donna M | $275,000 |
Source: Public Records
Tax History Compared to Growth
Tax History
| Year | Tax Paid | Tax Assessment Tax Assessment Total Assessment is a certain percentage of the fair market value that is determined by local assessors to be the total taxable value of land and additions on the property. | Land | Improvement |
|---|---|---|---|---|
| 2025 | $8,047 | $702,800 | $300,300 | $402,500 |
| 2024 | $7,792 | $681,700 | $300,300 | $381,400 |
| 2023 | $7,288 | $610,400 | $273,000 | $337,400 |
| 2022 | $6,852 | $525,900 | $227,400 | $298,500 |
| 2021 | $6,787 | $490,400 | $206,700 | $283,700 |
| 2020 | $6,456 | $475,400 | $206,700 | $268,700 |
| 2019 | $6,277 | $456,500 | $196,900 | $259,600 |
| 2018 | $6,385 | $443,100 | $187,500 | $255,600 |
| 2017 | $6,203 | $429,300 | $179,400 | $249,900 |
| 2016 | $5,799 | $396,400 | $170,900 | $225,500 |
| 2015 | $5,587 | $388,800 | $170,900 | $217,900 |
| 2014 | $5,232 | $367,400 | $162,700 | $204,700 |
Source: Public Records
Map
Nearby Homes
- 3 Oakdale Rd
- 12 Lockwood Rd
- 1 Evans Dr
- 5 Flynn Way
- 3 Adelman Rd
- 8 McDonald Rd
- 62 Faulkner Ave
- 96 Middlesex Ave
- 40 Faulkner Ave
- 1 Summer St
- 40 Agostino Dr
- 5 Oak St
- 27 Fairview Ave
- 220 Martins Landing Unit 309
- 260 Martins Landing Unit 508
- 260 Martins Landing Unit 103
- 300 Martins Landing Unit 107
- 62 Adams St
- 7 W Village Dr
- 320 Martins Landing Unit 108