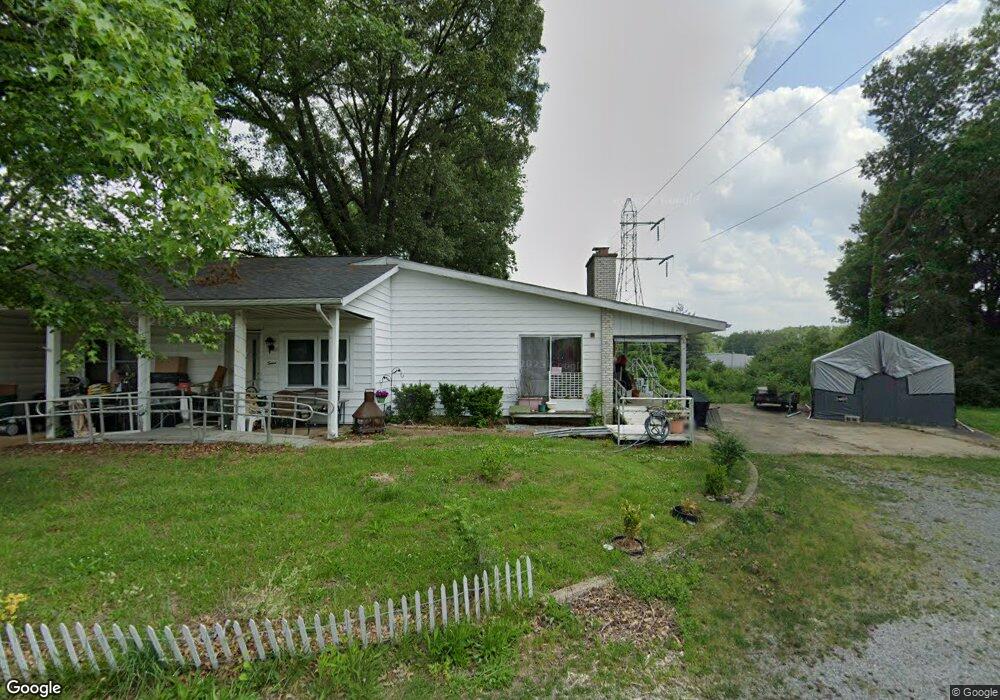
12 Cedar Dr Belleville, IL 62220
Estimated Value: $152,000 - $182,000
Studio
--
Bath
1,816
Sq Ft
$92/Sq Ft
Est. Value
About This Home
This home is located at 12 Cedar Dr, Belleville, IL 62220 and is currently estimated at $166,839, approximately $91 per square foot. 12 Cedar Dr is a home located in St. Clair County with nearby schools including Henry Raab Elementary School, Central Jr High School, and Governor French Academy.
Ownership History
Date
Name
Owned For
Owner Type
Purchase Details
Closed on
Jan 26, 2006
Sold by
Vaughn Donald G and Vaughn Melissa G
Bought by
Effinger Richard C and Effinger Beatrice
Current Estimated Value
Home Financials for this Owner
Home Financials are based on the most recent Mortgage that was taken out on this home.
Original Mortgage
$104,000
Outstanding Balance
$60,438
Interest Rate
6.75%
Mortgage Type
Fannie Mae Freddie Mac
Estimated Equity
$106,401
Purchase Details
Closed on
Nov 1, 2002
Sold by
Lyles Anthony and Lyles Lisa
Bought by
Vaughn Don and Vaughn Melissa
Create a Home Valuation Report for This Property
The Home Valuation Report is an in-depth analysis detailing your home's value as well as a comparison with similar homes in the area
Home Values in the Area
Average Home Value in this Area
Purchase History
| Date | Buyer | Sale Price | Title Company |
|---|---|---|---|
| Effinger Richard C | $110,000 | Chicago Title | |
| Vaughn Don | -- | -- |
Source: Public Records
Mortgage History
| Date | Status | Borrower | Loan Amount |
|---|---|---|---|
| Open | Effinger Richard C | $104,000 |
Source: Public Records
Tax History
| Year | Tax Paid | Tax Assessment Tax Assessment Total Assessment is a certain percentage of the fair market value that is determined by local assessors to be the total taxable value of land and additions on the property. | Land | Improvement |
|---|---|---|---|---|
| 2024 | $3,285 | $44,143 | $7,739 | $36,404 |
| 2023 | $3,516 | $44,575 | $7,632 | $36,943 |
| 2022 | $3,283 | $40,597 | $6,951 | $33,646 |
| 2021 | $3,246 | $38,931 | $6,666 | $32,265 |
| 2020 | $3,143 | $36,256 | $6,208 | $30,048 |
| 2019 | $3,143 | $37,148 | $6,335 | $30,813 |
| 2018 | $1,907 | $36,199 | $6,173 | $30,026 |
| 2017 | $3,037 | $35,236 | $6,009 | $29,227 |
| 2016 | $3,046 | $34,022 | $5,802 | $28,220 |
| 2014 | $2,711 | $34,164 | $5,829 | $28,335 |
| 2013 | $2,747 | $34,164 | $5,829 | $28,335 |
Source: Public Records
Map
Nearby Homes
Your Personal Tour Guide
Ask me questions while you tour the home.