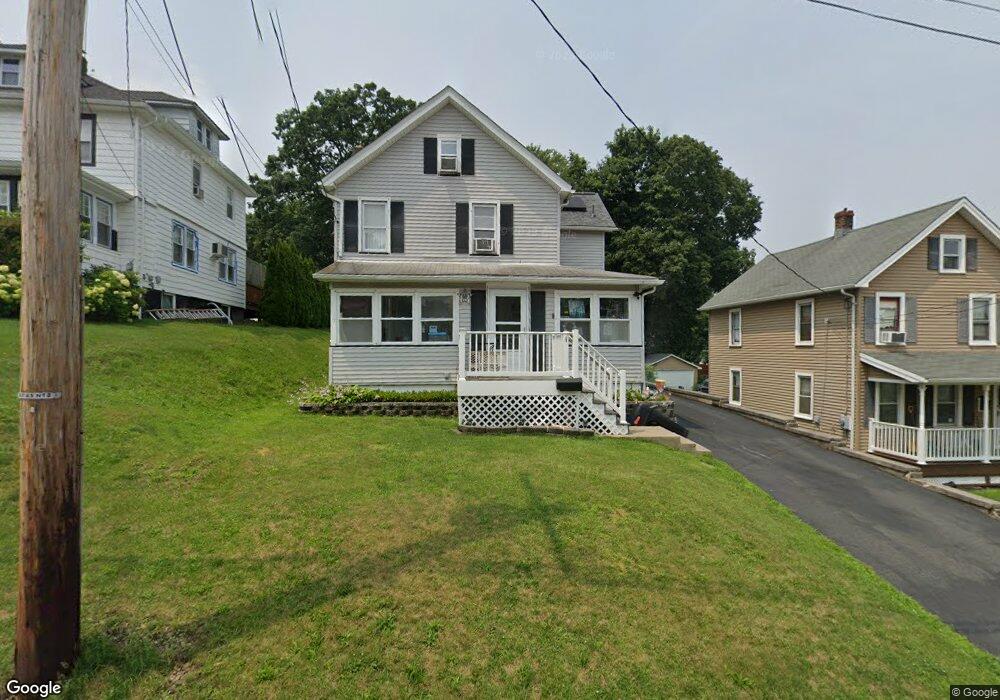
12 Center St Netcong, NJ 07857
Estimated Value: $401,903 - $479,000
Studio
--
Bath
1,444
Sq Ft
$306/Sq Ft
Est. Value
About This Home
This home is located at 12 Center St, Netcong, NJ 07857 and is currently estimated at $441,226, approximately $305 per square foot. 12 Center St is a home located in Morris County with nearby schools including Netcong Elementary School, Lenape Val Regional High School, and St. Therese School.
Ownership History
Date
Name
Owned For
Owner Type
Purchase Details
Closed on
Feb 7, 2002
Sold by
O'Grady Mark
Bought by
Miller William and Miller Melissa
Current Estimated Value
Home Financials for this Owner
Home Financials are based on the most recent Mortgage that was taken out on this home.
Original Mortgage
$132,500
Outstanding Balance
$54,865
Interest Rate
7.08%
Estimated Equity
$386,361
Purchase Details
Closed on
Oct 27, 1999
Sold by
Anthony Graham A and Anthony Marilyn J
Bought by
Ogrady Mark and Ogrady Florence
Home Financials for this Owner
Home Financials are based on the most recent Mortgage that was taken out on this home.
Original Mortgage
$117,900
Interest Rate
7.76%
Mortgage Type
FHA
Create a Home Valuation Report for This Property
The Home Valuation Report is an in-depth analysis detailing your home's value as well as a comparison with similar homes in the area
Home Values in the Area
Average Home Value in this Area
Purchase History
| Date | Buyer | Sale Price | Title Company |
|---|---|---|---|
| Miller William | $175,800 | -- | |
| Ogrady Mark | $105,000 | Commonwealth Land Title Ins |
Source: Public Records
Mortgage History
| Date | Status | Borrower | Loan Amount |
|---|---|---|---|
| Open | Miller William | $132,500 | |
| Previous Owner | Ogrady Mark | $117,900 |
Source: Public Records
Tax History
| Year | Tax Paid | Tax Assessment Tax Assessment Total Assessment is a certain percentage of the fair market value that is determined by local assessors to be the total taxable value of land and additions on the property. | Land | Improvement |
|---|---|---|---|---|
| 2025 | $8,976 | $263,400 | $125,600 | $137,800 |
| 2024 | $9,055 | $262,700 | $125,600 | $137,100 |
| 2023 | $9,055 | $262,700 | $125,600 | $137,100 |
| 2022 | $8,204 | $262,700 | $125,600 | $137,100 |
| 2021 | $8,204 | $262,700 | $125,600 | $137,100 |
| 2020 | $8,382 | $272,500 | $159,300 | $113,200 |
| 2019 | $7,979 | $272,500 | $159,300 | $113,200 |
| 2018 | $7,502 | $272,500 | $159,300 | $113,200 |
| 2017 | $7,208 | $272,500 | $159,300 | $113,200 |
| 2016 | $7,011 | $272,500 | $159,300 | $113,200 |
| 2015 | $6,755 | $272,500 | $159,300 | $113,200 |
| 2014 | $6,461 | $272,500 | $159,300 | $113,200 |
Source: Public Records
Map
Nearby Homes
Your Personal Tour Guide
Ask me questions while you tour the home.